CE-SDS analysis of Etanercept using BioPhase 8800 system
Zhichang Yang, Jane Luo, Marcia Santos, Sahana Mollah
SCIEX, Brea, CA, USA
Abstract
Etanercept has been widely used in the treatment of plaque psoriasis, psoriatic arthritis, ankylosing spondylitis, and rheumatoid arthritis for over 20 years. It works as a tumor necrosis factor (TNF) antagonist by binding to TNF molecules and preventing them from binding to the cell-bound receptors, which could otherwise lead to autoimmune disease when de-regulated TNF production occurs. Etanercept is a heavily glycosylated fusion protein consisting of the extracellular ligand-binding domain of human TNF receptor 2 (TNFR2) and the Fc domain of human IgG1. There are 2 N-glycosylation sites and 13 potential O-glycosylation sites on the TNFR2 domain, and one N-glycosylation site on the Fc domain.4 The glycosylation alone represents approximately 30% of the total molecular weight of Etanercept. The fusion protein is also a homodimer where disulfide bonds connect the two monomers. These properties combined make the protein structure very complex and highly heterogeneous. Furthermore, the physicochemical characterization of such molecules is very challenging. In this work, the BioPhase 8800 system was used to analyze Etanercept by Capillary Electrophoresis Sodium Dodecyl Sulfate (CE-SDS). The automated capillary electrophoresis instrument offers fast separation times and proven high reproducibility. When faced with the challenge of analyzing complex proteins under different conditions, performing CE-SDS analysis one separation at a time can be time-consuming. The multi-capillary capability of the BioPhase 8800 system allowed for the simultaneous analysis of Etanercept under different deglycosylation reaction conditions, deglycosylation time-course, and assess the consistency of deglycosylation reactions in other lots, accelerating methods development for protein analysis.
Introduction
Etanercept has been widely used in the treatment of plaque psoriasis, psoriatic arthritis, ankylosing spondylitis, and rheumatoid arthritis for over 20 years.1, 2 It works as a tumor necrosis factor (TNF) antagonist by binding to TNF molecules and preventing them from binding to the cell-bound receptors—which could otherwise lead to autoimmune disease when de-regulated TNF production occurs.3 Etanercept is a heavily glycosylated fusion protein consisting of the extracellular ligand-binding domain of human TNF receptor 2 (TNFR2) and the Fc domain of human IgG1.4 There are 2 N-glycosylation sites and 13 potential O-glycosylation sites on the TNFR2 domain and one N-glycosylation site on the Fc domain.4 The glycosylation alone represents approximately 30% of the total molecular weight of etanercept.5 The fusion protein is also a homodimer where disulfide bonds connect the two monomers. These properties combined make the protein structure very complex and highly heterogeneous. The physicochemical characterization of such molecules is very challenging.
Capillary electrophoresis-sodium dodecyl sulfate (CE-SDS) separates proteins based on size. It has been used in applications such as protein characterization, purity assessment, stability testing and lot release.6 It is one of the most powerful separation techniques in the analytical chemistry toolbox because it offers a high speed of analysis, high resolution, and quantification. It is robust and reproducible and amenable to automation. In this work, the BioPhase 8800 system (Figure 1) was used to analyze etanercept by capillary electrophoresis-sodium dodecyl sulfate (CE-SDS). The automated capillary electrophoresis instrument offers fast separation times and proven high reproducibility.6, 7 When faced with the challenge of analyzing complex proteins under different conditions, performing CE-SDS analysis one separation at a time can be time-consuming. The multi-capillary capability of the BioPhase 8800 system allowed for the simultaneous analysis of etanercept under different deglycosylation reaction conditions, deglycosylation time-course, and assessing the consistency of deglycosylation reactions in other lots, accelerating methods development for protein analysis.
 Click to enlarge
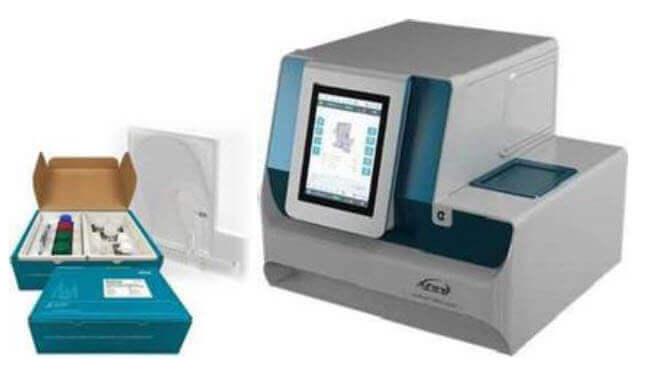
Figure 1. The BioPhase 8800 system equipped with LIF and UV detectors and consumable/reagent kits.
Key features
- Multi-capillary separation on the BioPhase 8800 system enables simultaneous analysis of multiple etanercept samples prepared under different conditions (reduction and deglycosylation)
- Pre-assembled cartridge and ready to use CE-SDS kit and consumables simplifies operation
- A time-course approach was used to help determine the optimal deglycosylation incubation periods for etanercept. The study indicates complete deglycosylation of etanercept was achieved within 1.5 hours.
- The deglycosylation reaction conditions were applied to other lots to quickly evaluate the reaction consistency, made possible with the parallel processing capabilities of the BioPhase 8800 system, significantly shortening the overall analysis time
 Click to enlarge
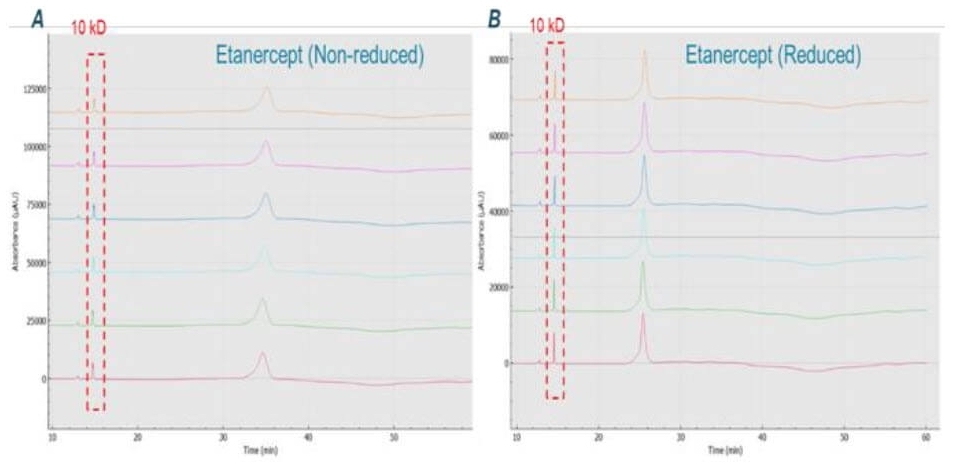
Figure 2. Overlay of 6 consecutive injections of etanercept. Panel A and B show etanercept the non-reduced and reduced forms, respectively. 10kD: 10 kilodaltons internal molecular weight standard.
Methods
Chemicals: BioPhase CE-SDS Protein Analysis Kit (Part # C30085, SCIEX, Brea, CA) with the SDS-MW separation gel buffer, 10 kD internal standard, basic wash, acidic wash, and sample buffer were from SCIEX (Framingham, MA, USA). The etanercept was from Immunex Corporation (Seattle, WA, USA). The Protein Deglycosylation Mix II (Part # P6044) was from New England Biolabs (Ipswich, MA, USA). The iodoacetamide (Part # I6125-5G) and the 2-mercaptoethanol (Part # M3148-25ML) were from Sigma Aldrich (St. Louis, MO, USA).
Materials and instruments: BioPhase 8800 system (Part # 5083590F), BioPhase BFS capillary cartridge - 8 x 30 cm (Part # 5080121) and Sample and Reagent Plates (Part # 5080311) were from SCIEX (Framingham, MA, USA). Multi-therm shaker incubator (Part # H5000-H) was from Benchmark Scientific (NJ, USA).
Software: The BioPhase analysis software package (version 1.0) was used for creating run method and sequence, data acquisition, and processing.
Sample preparation: The sample preparation process followed the standard SDS-MW analysis assay kit protocol. Briefly, 4 µL of etanercept (25 µg/µL) was combined with 91 µL of SDS-MW Sample Buffer, followed by 2 µL of 10 kDa Internal Standard and 5 µL of 250 mM iodoacetamide for non-reduced sample or β-mercaptoethanol (β-ME) for the reduced sample. The sample mixture was vortexed and centrifuged and then heat denatured at 70°C for 10 min. Afterward, the sample was cooled to room temperature, and 100 µL sample solution was transferred to the sample plate for CE-SDS analysis.
Deglycosylation: The deglycosylation protocol from the Protein Deglycosylation Mix II (New England Biolabs, Part # P6044) kit was followed without modifications. In summary, 4 µL of etanercept (25 µg/µL) was diluted in 36 µL of water. For deglycosylation under denaturing conditions, 5 µL of Deglycosylation Mix Buffer 2 was added followed by incubation at 75 °C for 10 min. The sample was cooled to room temperature (RT). For deglycosylation under non-denaturing conditions, 5 µL of the Deglycosylation Mix Buffer 1 was added without heating incubation. Next, 5 µL of Protein Deglycosylation Mix II was added. The sample was vortexed, centrifuged, and kept at room temperature (RT) for 30 min. The denaturing reaction mix was incubated for 1 hour, whereas the non-denaturing reaction was incubated for 16 hours at 37°C. The time-course analysis was performed as follows: the incubation at 37 °C was extended to 4 hours, and the reaction was stopped by storing the samples at ‑20°C at different time points as follows: RT for 0 min, RT for 20 min, 37°C for 0 min, 37°C for 20 min, 37°C for 1 h, 37°C for - 2 h, 37°C for 4 h. A blank sample was processed following the denaturing deglycosylation protocol described earlier, only with no addition of etanercept and no incubation.
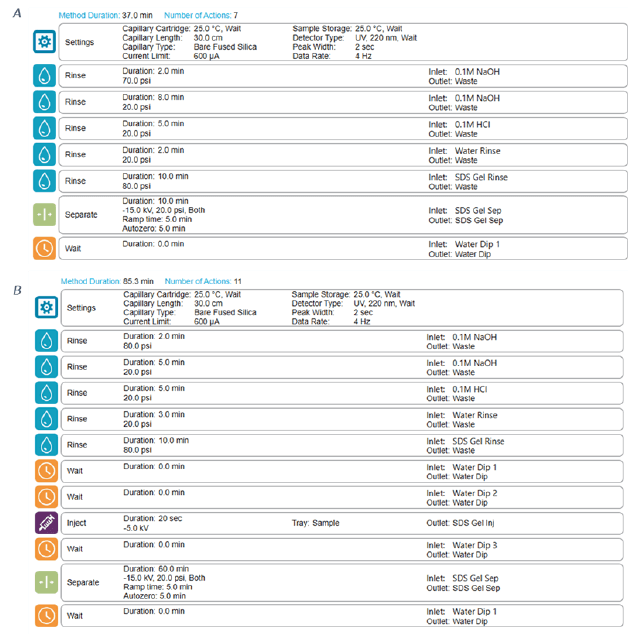
BioPhase SDS-gel electrophoresis: This study was carried out using the multi-capillary system BioPhase 8800 equipped with UV absorbance detection at 220 nm. The separations were accomplished using the BioPhase BFS capillary cartridge filled with SDS-MW separation gel buffer. The capillary conditioning method was performed as shown in Figure 3 panel A. The Conditioning method was performed at the beginning of each sequence. The sample storage compartment and separation cartridge were set at 25°C at all times. Details of separation method are shown in Figure 3 panel B. The BioPhase analysis software package (version 1.0) was used for creating run method and sequence, data acquisition and processing.
 Click to enlarge
Figure 3. Screenshot of conditioning and separation method on the BioPhase 8800 system. Panel A shows the detailed settings for the conditioning method, Panel B for the separation method.
Results and discussion
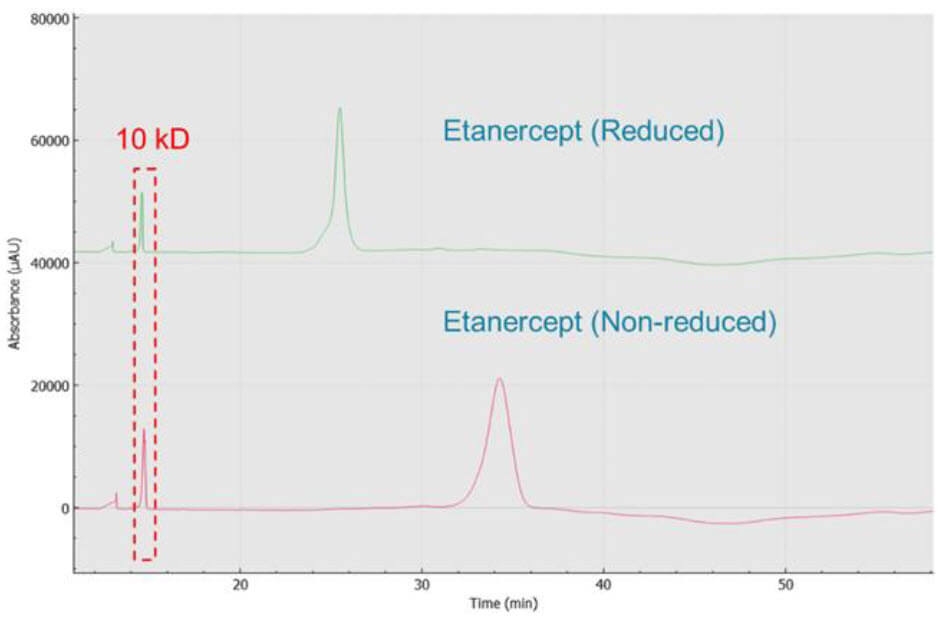
Analysis of reduced and non-reduced forms of etanercept: Figure 4 shows the results obtained by analyzing reduced and non-reduced etanercept with CE-SDS kit on BioPhase 8800 system. The non-reduced form shows a peak width at the base of almost 4 min, possibly indicating this intact molecule is highly heterogeneous. The reduction of the disulfide bonds after reaction with β-ME, led to the formation of the smaller monomeric species. Consequently, these smaller species exhibited a shorter migration time (MT). Additionally, the peak width became sharper, with width at the base reduced to 3.2 min. No obvious impurities were observed from both non-reduced and reduced conditions. This result corroborates with the observations of Cho et. al4.
 Click to enlarge
Figure 4. CE-SDS separation of etanercept. Reduced and non-reduced forms are both analyzed by CE-SDS.
Repeatability of CE-SDS analysis of etanercept on the BioPhase 8800 system: Six consecutive injections of etanercept in both non-reduced and reduced forms are shown in Figure 2 panel A and B, respectively. Figure 2 also shows the great reproducibility across 6 repetitions. The corrected peak area and MT of the reduced form have RSD% of 1.04% (N=6) and 0.35% (N=6), respectively. The corrected peak area and MT of non-reduced form have RSD% of 2.12% (N=6) and 0.6% (N=6), respectively. The reproducibility of these results indicates good on-board sample stability of reduced and non-reduced etanercept over a period of 8 hours. Most notably, this repeatability study of non-reduced and reduced forms of etanercept were performed separately with two sample plates.
Analysis of deglycosylated etanercept: The broad peak width observed in both reduced and non-reduced forms of etanercept indicated the heterogeneous character of this fusion protein. The heterogeneity can come from the protein’s glycosylation pattern or amino acids variation to the backbone. In reduced monomers, the protein backbone has 3 N-glycosylation sites and potentially 13 O-glycosylation sites. The O-linked glycans can vary in length and combinations, making the protein structure very complicated. To determine whether the protein has amino acid variations, etanercept was deglycosylated. For the deglycosylation study, we used the Protein Deglycosylation Mix II from New England Biolabs. The product contains all enzymes, reagents, and controls needed to remove all N-linked and simple and some complex O-linked glycans. We investigated the deglycosylation of etanercept under non-denaturing and denaturing conditions following the manufacturer’s protocol.
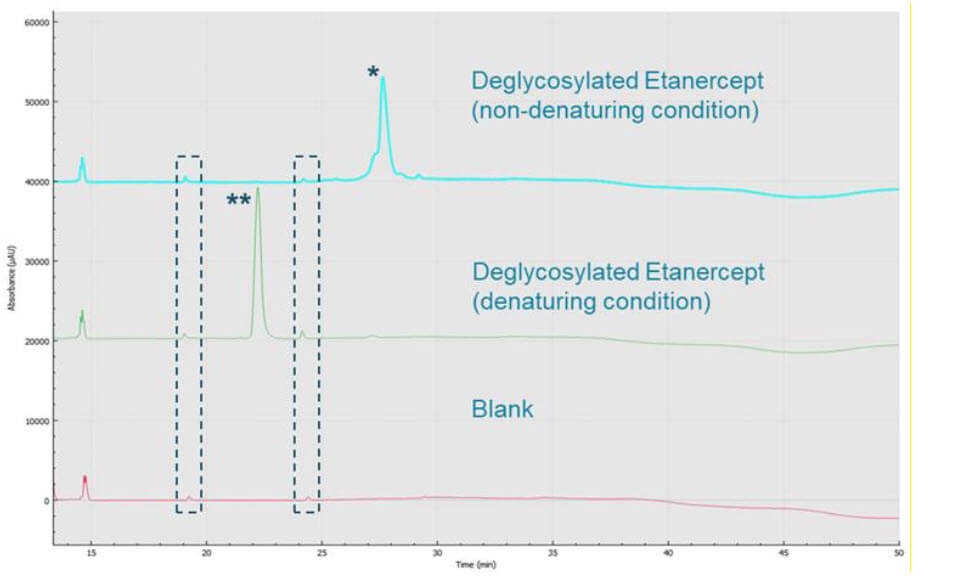
As shown in Figure 5, the multiple small peaks flanking the etanercept peak (marked with an asterisk) when deglycosylated under non-denaturing conditions possibly indicate disulfide bond variations. Further examination is necessary to determine the source of the numerous peaks. The deglycosylation of etanercept under denaturing conditions revealed an electropherogram one single sharp peak (marked with double asterisk), indicating that by deglycosylating and further denaturing this molecule, thereby removing much of the structural heterogeneity and complexity, is reflected in the sharp peak shape. Other small peaks migrating around 19.5 and 24.5 min, on both electropherograms, are also present in Blank sample (inside the dashed rectangles), which should be from the deglycosylation enzymes. Note the Blank sample went through all the procedures of performing denaturing deglycosylation, only with no addition of etanercept and no incubation.
 Click to enlarge
Figure 5. BioPhase 8800 system analysis of etanercept under different reaction conditions. CE-SDS separations of etanercept treated with two different deglycosylation conditions. Etanercept peaks were marked with asterisk(s).
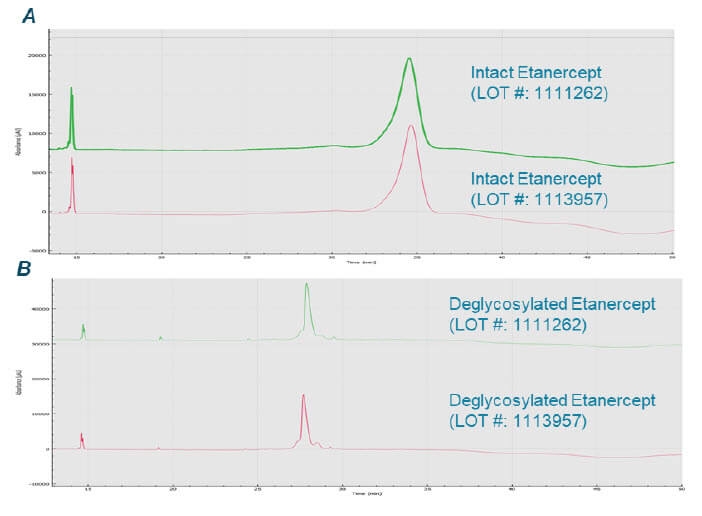
Lot-lot comparison of etanercept: We also performed a lot-lot comparison of etanercept in both intact and deglycosylated forms. There is no significant difference of the etanercept across two lots, as indicated in the upper panel of Figure 6. The multiplex capability of BioPhase 8800 system enabled simultaneous analysis of samples under multiple reaction conditions and from different lots, highlighting the power of the BioPhase 8800 system to examine lot-lot differences and explore different reaction conditions.
 Click to enlarge
Figure 6. BioPhase 8800 system analysis of etanercept from different lots. Panel A shows CE-SDS electropherograms of intact etanercept from two different lots. Panel B shows CE-SDS electropherograms of etanercept from two different lots treated under non-denaturing deglycosylation condition.
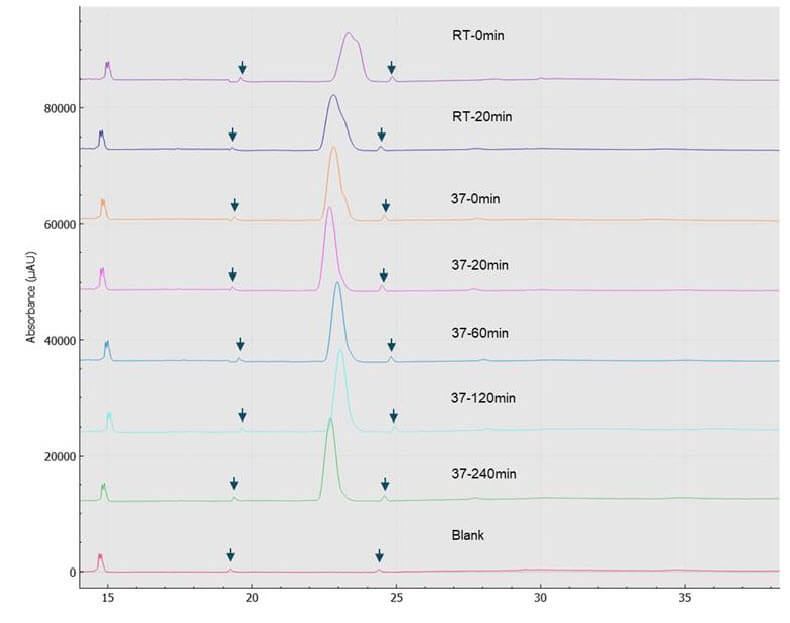
Time course analysis of deglycosylation of etanercept: Due to the complex glycosylated pattern of etanercept, a longer incubation time for thorough deglycosylation may be needed. To determine the optimal incubation time, we performed a time-course analysis of the deglycosylation reaction. For this study, we chose deglycosylation under denaturing conditions. After adding the enzyme mix to the protein solution, we followed the manufacturer’s recommendation to start the reaction by leaving it at room temperature for 30 min then increasing the temperature to 37°C for 1 hr. However, for the time-course analysis, we extended the incubation at 37°C to 4 hours. The time points collected were 0 min and 20 min, for the room temperature stage and 0 min, 20 min, 60 min, 120 min, and 240 min for the 37°C stage. Figure 7 shows the electropherograms of the reaction time-course. Most notably, after 60 min at 37°C, we didn’t observe significant differences. The RSD% of corrected peak area % of the etanercept peaks at 37°C for 60 min, 37°C for 120 min and 37°C for 240 min is only 0.65%. All these facts possibly indicate a thorough deglycosylation in 60 min. Again, the small peaks flanking the etanercept peak (annotated by arrows in the figure) are likely from the deglycosylation kit, as they are also present in the Blank sample. The BioPhase 8800 system allowed for the parallel processing of these samples, significantly shortening CE-SDS analysis time to 1 hr vs. 8 hr in a single capillary system.
 Click to enlarge
Figure 7. Time course study of etanercept deglycosylation (denaturing condition).
Conclusions
- The BioPhase 8800 system achieved reproducible results on CE-SDS analysis of etanercept both in reduced and non-reduced forms
- The multi-capillary system enabled parallel analyses of etanercept treated under different deglycosylation conditions and from different lots
- A time-course analysis was performed to explore the optimal deglycosylation period of etanercept in denaturing conditions. The BioPhase 8800 system enabled parallel analysis of the sample collected at different time points and accelerated the overall workflow.
References
- Tracey D, Klareskog L, Sasso EH, Salfeld JG, Tak PP. Tumor necrosis factor antagonist mechanisms of action: a comprehensive review. Pharmacol Ther. 2008 Feb;117(2):244-79.
- Goffe B, Cather JC. Etanercept: An overview. J Am Acad Dermatol. 2003 Aug;49(2 Suppl):S105-11.
- Kollias G, Kontoyiannis D. Role of TNF/TNFR in autoimmunity: specific TNF receptor blockade may be advantageous to anti-TNF treatments. Cytokine Growth Factor Rev. 2002 Aug-Oct;13(4-5):315-21.
- Cho IH, Lee N, Song D, Jung SY, Bou-Assaf G, Sosic Z, Zhang W, Lyubarskaya Y. Evaluation of the structural, physicochemical, and biological characteristics of SB4, a biosimilar of Etanercept. MAbs. 2016 Aug-Sep;8(6):1136-55.
- Wohlschlager T, Scheffler K, Forstenlehner IC, Skala W, Senn S, Damoc E, Holzmann J, Huber CG. Native mass spectrometry combined with enzymatic dissection unravels glycoform heterogeneity of biopharmaceuticals. Nat Commun. 2018 Apr 30;9(1):1713.
- Roy E, Zuzana D, Tingting L, Marcia S, Andras G, Sahana M. High-throughput multi-capillary SDS gel electrophoresis of proteins. SCIEX technical note, number RUO-MKT-02-13394-A.
- Fang W, Andras G, Mark L, Sahana M. Rapid and reproducible parallel processing of charge heterogeneity analysis of protein therapeutics by multi-capillary isoelectric focusing. SCIEX technical note, number RUO-MKT-02-13492-A.