High-throughput multi-capillary SDS gel electrophoresis of proteins
Rapid and robust characterization of biotherapeutics
Roy Estrada, Zuzana Demianova, Tingting Li, Marcia Santos, Andras Guttman, and Sahana Mollah
SCIEX, Brea, CA, USA
Abstract
Scientists analyzing biotherapeutics are challenged to rapidly and robustly characterize an increasing number and wider variety of drug candidates in less time. Automated capillary electrophoresis instruments offer fast separation times and proven, high reproducibility for capillary sodium dodecyl sulfate gel electrophoresis (SDS-CGE), thus represents an excellent tool for the analysis of therapeutic proteins. However, due to current system’s single capillary format, the throughput can be limited. The SCIEX BioPhase 8800 electrophoresis platform utilized a multicapillary format which can assist in alleviating this issue, enabling characterization to be performed on multiple samples in parallel.
Introduction
Protein based biopharmaceuticals represent an important class of therapeutic agent that has high efficacy. First generation monoclonal antibodies (mAbs), revolutionized the therapeutic landscape for many diseases. More recently, new modalities such as multi-specific antibodies, fusion proteins, antibodydrug conjugates, and nanobodies have emerged in many fields of medicine, including: oncology, inflammatory, infectious, neurological diseases, and imaging.1-3 Purity assessment of these therapeutic entities and determination of any structural variances introduced during manufacturing, is of high importance for the biopharmaceutical industry. One of the most frequently used techniques for rapid characterization, release and stability testing for protein therapeutics is sodium dodecyl sulfate capillary gel electrophoresis.4 It is well known that 1 g of protein can uniformly bind with 1.4 g SDS. This ratio leads to a similar charge to the hydrodynamic volume ratio of the protein-SDS complexes. The CGE provides a sieving matrix for size-based separation.
The industry standard method enabling size separation is utilization of a carefully designed sieving matrix5 optimized for analysis up to several hundred kilodaltons, making it amenable to characterization of nanobody, mAb, and fusion protein analysis.6 Optimization of separation parameters, such as temperature, can be used to improve resolution and separation performance.7, 8
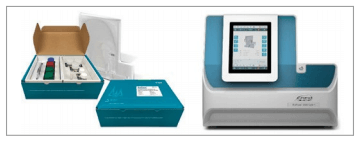
Figure 1. The BioPhase 8800 system equipped with consumable/reagent kits, LIF and UV detectors.
In this work, SDS-CGE analysis of multiple samples simultaneously to accelerate overall analysis time and potentially shorten product development workflows will be demonstrated. The BioPhase 8800 system additionally allows for analysis using UV and fluorescent detection in the same sequence, further reducing method development time.
Key Features
- Multi-capillary separation enables high throughput screening, shortens method development and optimization time, and provides the ability to multiplex batch analysis to speed up the design of experiment (DOE) efforts.
- Seamless transfer of methods from single-capillary PA 800 Plus to multi-capillary BioPhase 8800.
- Pre-assembled cartridge and kitted reagent/consumables to help simplify operation and minimize user deviation.
- Integrated detection enables automated switching between UV and LIF detectors
- Streamlined acquisition and analysis software with the ability to multiplex data integration and decrease data processing time.
- Wide-linear dynamic range (4 orders of magnitude) for NISTmAb, resulting in 2.4 μg/mL and 4 ng/mL LOD, and 4.9 μg/mL and 10 ng/mL LOQ, with the use of UV and LIF detectors.
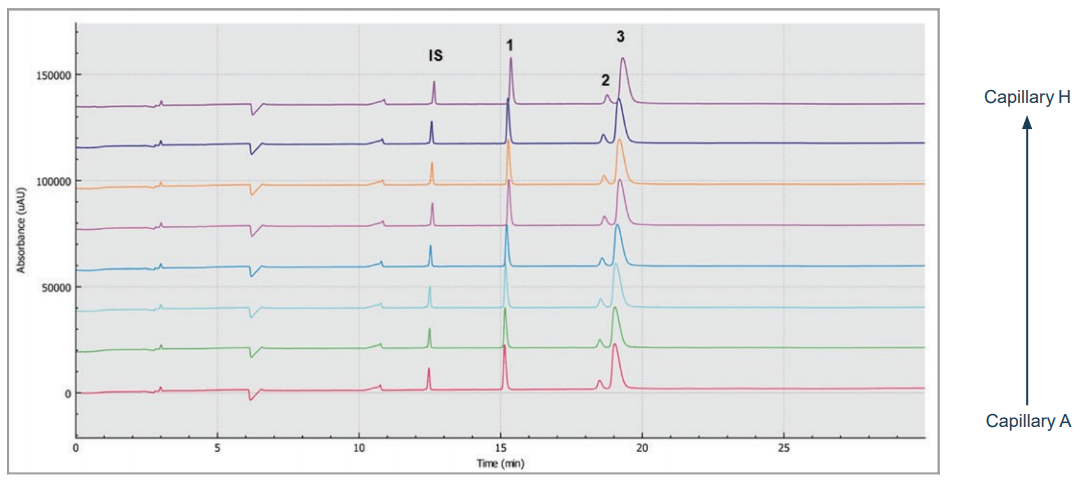
Figure 2. Multi-capillary SDS gel electrophoresis of a monoclonal antibody sample. Traces A to H represent the separation in the eight individual capillaries of the BioPhase 8800 system. Peaks: IS - 10 kDa internal standard, 1 – light chain, 2 – non-glycosylated heavy chain, 3 – heavy chain. Conditions: 15kV reversed polarity with 1 minute ramp time and with 20 psi applied at both inlet and outlet reservoirs during separation. UV detection at 220 nm.
Experimental
Chemicals: The SDS-MW analysis assay kit (Part # 390953) with the SDS-MW gel buffer, sample buffer, the 10 kDa protein internal standard and the IgG Control Standard (PN 391734) were from SCIEX (Framingham, MA, USA). The IgG, HPLC grade water, 2-mercaptoethanol and all other chemicals were from Sigma Aldrich (St. Louis, MO, USA).
Sample preparation: The sample preparation process followed the standard SDS-MW analysis assay kit (SCIEX, Part # 390953) protocol. The IgG Control Standard (950 μL) was combined with 20 μL of the 10 kDa protein internal standard and 50 μL 2-mercaptoethanol. The sample was mixed thoroughly followed by incubation at 70° C for 10 minutes. The sample was then cooled to room temperature and distributed into 100 μL aliquots across 8 injecting well positions in the injection sample plate.
Single and multi-capillary SDS-gel electrophoresis: All single capillary electrophoresis analyses were performed using a PA 800 Plus pharmaceutical analysis system (Part # A74603, SCIEX) with UV absorbance detection mode at 220 nm. The EZ-CE cartridge (Part # A55625) with a 20 cm effective length (30 cm total length), 50 μm ID bare fused silica capillary was filled with the SDS-MW gel-buffer system. Capillary conditioning: 0.1 M NaOH rinse for 3 minutes at 70 psi, 0.1 M HCl rinse for 1 minute at 70 psi, HPLC grade water rinse for 1 minute at 70 psi and SDS-MW gel buffer rinse for 10 minutes at 80 psi before each run. The applied electric field strength was 500 V/cm in all capillary electrophoresis analyses in reversed polarity mode (anode at the detection side). The samples were electrokinetically injected at 5 kV for 20 seconds.
The multi-capillary separations utilized the BioPhase 8800 system (SCIEX). The detection, gel-buffer system, capillary conditioning, injection, and separation conditions were the same as those in the single capillary analyses. The separations were accomplished in the BioPhase BFS capillary cartridge – 8 x 30 cm (Part # 5080121, SCIEX). The BioPhase analysis software package was used for data acquisition and processing.
LOD, LOQ, and linear dynamic range determination: The 10 mg/mL stock solution NIST Monoclonal Antibody (Reference Material 8671, NIST, Gaithersburg, MD) was diluted to 5 mg/mL in the SDS-MW sample buffer and reduced by βmercaptoethanol (5% v/v) together with 10 kDa marker (used as mobility marker, 2% v/v). The mixture was heated to 70° C for 10 minutes, followed by 3 min of cool-down. A serial dilution of the reduced NIST sample was prepared by diluting the 5 mg/mL solution directly into the CE-SDS sample buffer. The sample dilution range was from 5 mg/mL to 1.22 μg/mL with 4x dilution in the first three, and 2x dilution afterwards, for UV detection. For LIF detection, the concentration range was 38 μg/mL to 4 ng/mL
Results and Discussion
This study evaluates a multi-capillary electrophoresis system (BioPhase 8800 system) in respect to migration time and the corrected peak area% reproducibility in SDS-CGE of a monoclonal antibody,and compares the results to a single capillary electrophoresis unit (PA 800 Plus). The SCIEX SDS-MW gel buffer was used in all experiments as separation matrix.
Migration time and peak area reproducibility
Figure 2 shows eight SDS-CGE electropherograms, simultaneously obtained by the BioPhase 8800 system. High resolution separation of all sample components, including the light chain (LC, peak 1), non-glycosylated heavy chain (NG HC) and the heavy chain (HC, peak 3) fragments, was obtained.
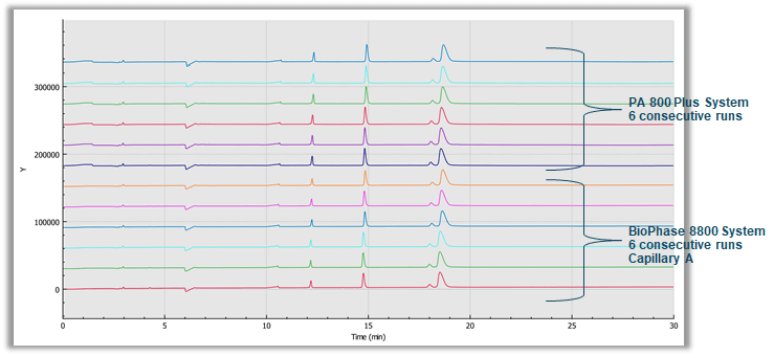
The 10 kDa protein was added to all samples as an internal standard and used for relative migration time calculation. The average relative migration time reproducibility of the BioPhase 8800 system for the heavy chain fragment was RSD=1.1%, as depicted in Table 1. The average corrected peak area% reproducibility was RSD=0.85% for the non-glycosylated heavy chain, the smallest peak in the separation trace (Table 2). Please note that peak area reproducibility is usually lower for smaller peaks. The migration time reproducibility of 15 consecutive injections was evaluated on both the BioPhase 8800 system (Figure 3, left panel) and the single capillary PA 800 Plus Pharmaceutical Analysis system (Figure 2, right panel). Excellent relative migration time RSDs were obtained for the BioPhase 8800 system (RSD=0.83%, left panel) and for the PA 800 Plus (RSD=0.03%, right panel). Considering the 30 min separation time per run, for 15 runs, the total analysis time for the entire set was approximately 8 hours on the PA 800 Plus. In comparison, the BioPhase 8800 system could run 64 samples (versus 15) in the same time.
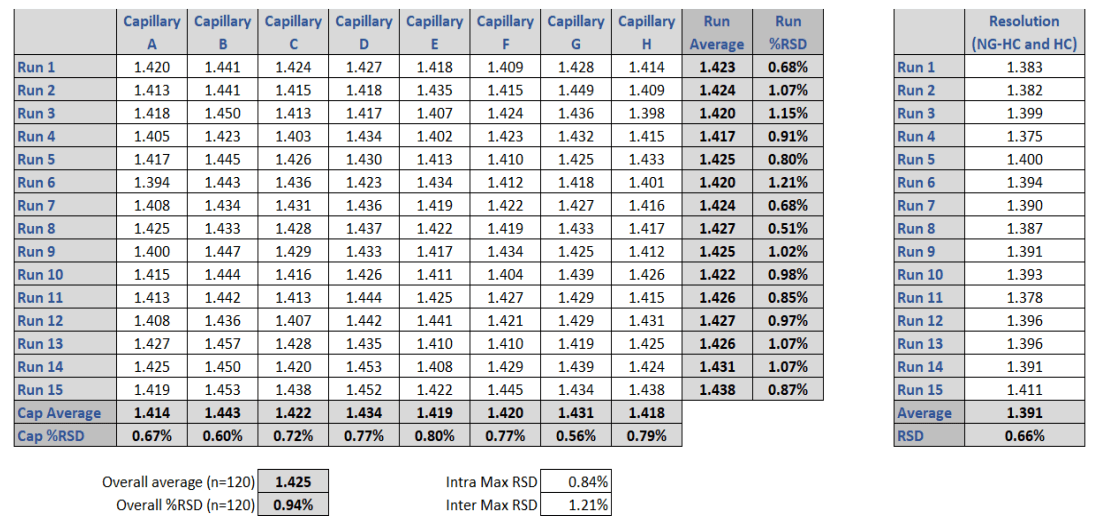
Table 1. Comparison of the relative migration times of the heavy chain (HC) peak in the multi- and single capillary electrophoresis instruments. Left panel: lane to lane (A-H) and run to run (1-16) migration times obtained by the BioPhase 8800 system. Right panel: run to run (1-15) migration times obtained by the PA 800 Plus single capillary system. The %RSD for the BioPhase 8800 system is 1.1% which correlates well with the 0.83 %RSD obtained with the PA 800 Plus system.
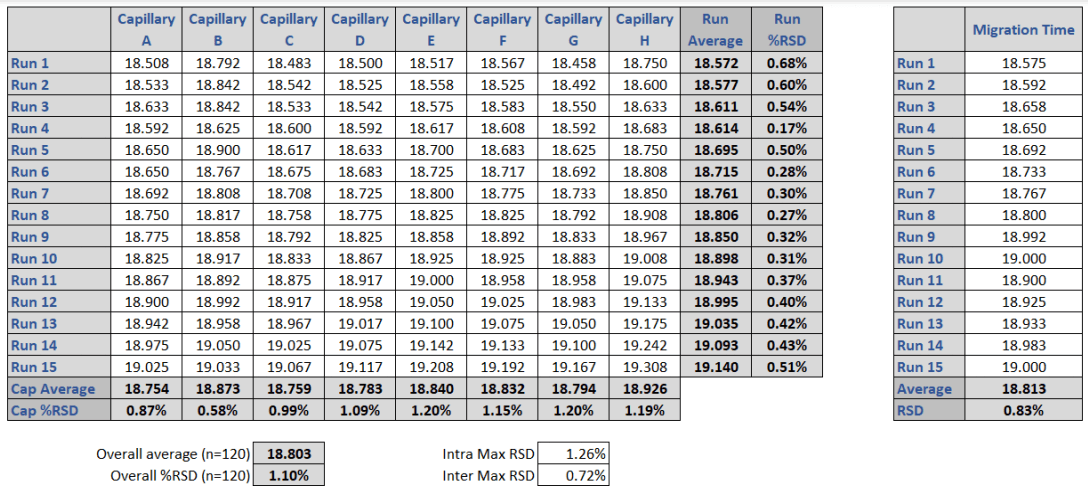
Table 2. Comparison of the corrected peak area% values of the non-glycosylated heavy chain (ng-HC) peak in the multi- and single capillary electrophoresis instruments. Left panel: lane to lane (A-H) and run to run (1-15) corrected peak area% values obtained by the BioPhase 8800 system. Right panel: run to run (1-15) corrected peak area% values obtained by the PA 800 Plus single capillary system. The %RSD for the BioPhase 8800 system is 0.85% which correlates well with the 0.54 %RSD obtained with the PA 800 Plus Pharmaceutical Analysis system.
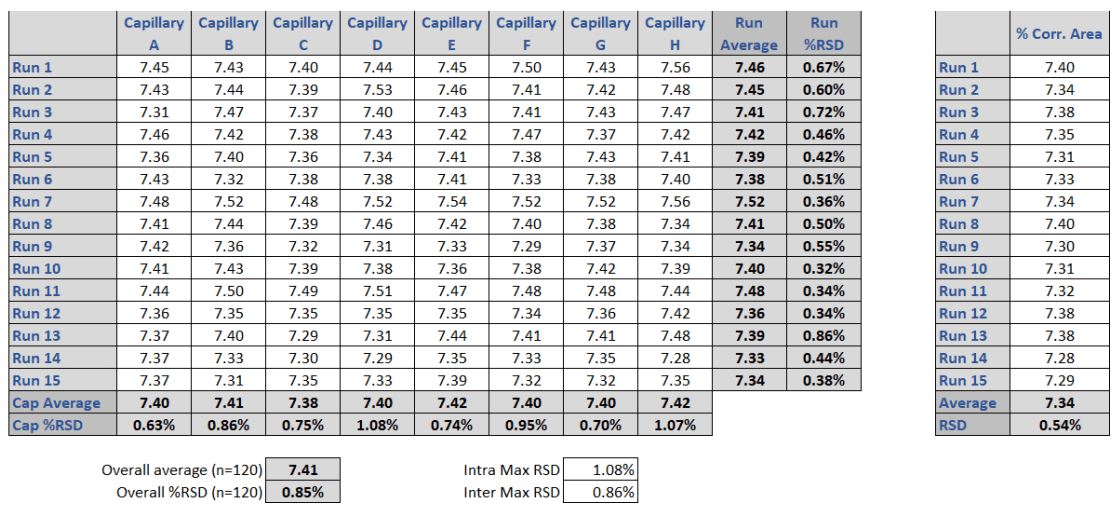
Figure 3. Comparative chart of six consecutive SDS-CGE separations of the reduced mAb sample on the multi-capillary BioPhase 8800 system and the single capillary PA 800 Plus Pharmaceutical Analysis system.
Resolution
The capability to resolve the non-glycosylated heavy chain (ng-HC) from the heavy chain (HC) in mAb characterization is important, as this assay attribute is commonly used to help define molecular stability. In both systems, excellent baseline separation of these two critical mAb fragments was obtained. Table 3 shows the resolution values for all runs on each single capillary of the multi-capillary system in comparison to the single capillary unit. The average resolution value for the BioPhase 8800 system was Rs=1.425, compared to the single capillary PA 800 Plus Pharmaceutical Analysis system, which resulted in Rs=1.391.
Table 3. Resolution values in SDS-CGE obtained between the regular (HC, glycosylated) and non-glycosylated (ng-HC) heavy chain fragment of a monoclonal antibody sample using the BioPhase 8800 system (left panel) and the single capillary PA 800 Plus Pharmaceutical Analysis instrument (right panel). The resolution for the Biophase is Rs=1.425 which correlates well with the Rs=1.391 obtained with the PA 800 Plus system.
Limit of detection and quantification by UV and LIF
The limit of detection (LOD), limit of quantification (LOQ) and linear range was first evaluated with UV detection. A serial dilution of the NIST monoclonal antibody standard was used for this study starting from 5 mg/mL solution all the way down to as low as 1.2 μg/mL. Figure 4, depicts the results showing excellent linearity for both linear-linear (panel A, r2=0.999) and log-log (panel C, r2=0.997) plots, the latter for the better visibility in the lower concentration range. The LOD with the signal to noise ratio value of S/N=3 was 2.4 μg/mL, while the LOQ with the signal to noise ratio value of 10 was S/N=4.9 μg/mL. As one can observe, the UV detection signal response was linear over 4 orders of magnitude. Panel B shows the relevant electropherogram sections with 300, 4.9 and 2.4 μg/mL sample injections. The detection linearity and limit (LOD and LOQ) data were similar to what was obtained earlier with the PA 800 Plus.9
The LOD, LOQ and detection range linearity were also evaluated with the higher sensitivity LIF detection. Similarly, a serial dilution of the standard NIST monoclonal antibody was used. However, in this instance, the range was from 38 μg/mL down to 4 ng/mL, considering the significantly greater detection sensitivity of the LIF system. Figure 5, shows the results with optimal linearity for both the linear-linear (panel A, r2=0.9999) and log-log (panel C, r2=0.9996) plots over the nearly 4 orders of magnitude concentration range. The LOD with the signal to noise ratio of S/ N=3 was 4 ng/mL, while the LOQ with the S/N=8 was 10ng/mL. Panel B, shows the relevant electropherogram sections from 38 μg/mL to 4 ng/mL concentration sample injections, all in individual capillaries of the multi-capillary system. This saved significant time as the entire concentration range can be evaluated in a single run. To increase the precision of the approach, the variance between the capillaries was normalized to the 10 kDa internal standard.
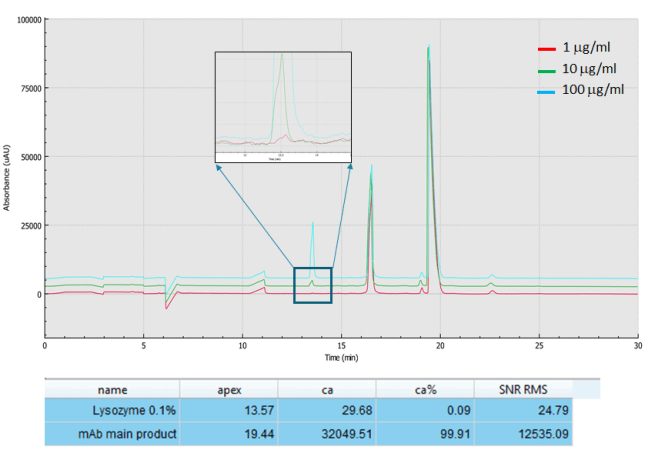
ICH Q3A provides recommendations to include information regarding specified impurities in certain new drug applications (NDAs), both for identified and unidentified impurities in new drug substance specifications. It also requires acquiring and evaluating data that establishes the biological safety of individual impurities, or a given impurity profile, at the levels defined. Regulators specify 0.1% impurity level to the main drug product. Figure 6, shows the analysis of 1000 mg/ml USP mAb 003, monoclonal IgG1 spiked with lysozyme at 100, 10 and 1 μg/ml levels, demonstrating the capability of the BioPhase 8800 system multi-capillary electrophoresis platform to readily detect the required 0.1% impurity level in the main product.
Figure 4. UV detection linearity, LOD and LOQ determination for the NIST monoclonal antibody standard with the BioPhase 8800 system using linearlinear (A) and log-log (C) interpretations. Panel B depicts the relevant electropherogram sections with 300, 4.9 and 2.4 μg/mL sample injections.
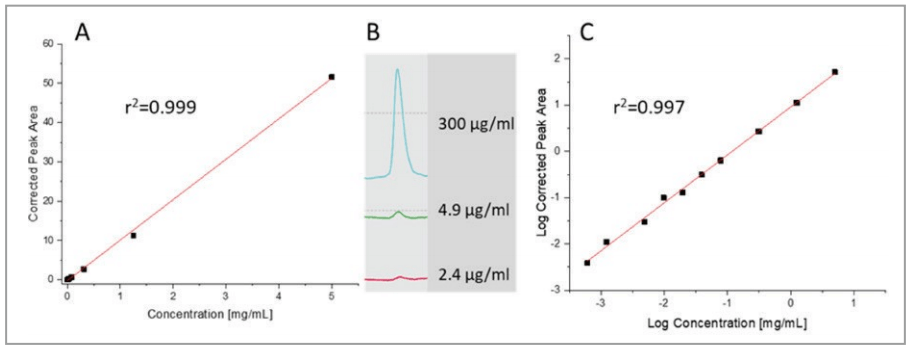
Figure 5. LIF detection linearity, LOD and LOQ for the NIST monoclonal antibody standard with the BioPhase 8800 system using linear-linear (A) and log-log (C) interpretations. Panel B depicts the relevant electropherogram sections from 38 μg/mL to 4 ng/mL sample injections.
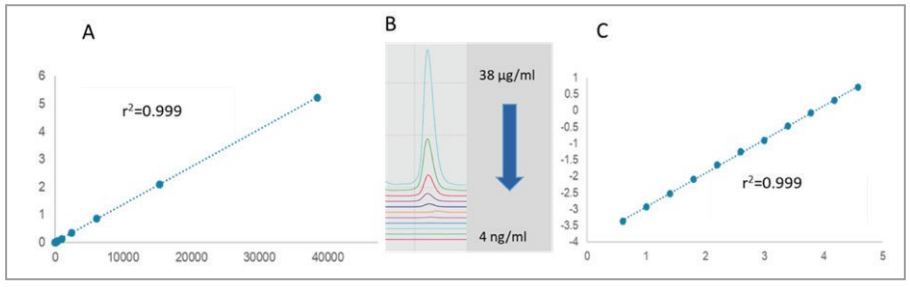
Figure 6. Impurity analysis down to 0.1% of the main product (0.1% of lysozyme spiked into an IgG sample) with the BioPhase 8800 system. Conditions were the same as Figure 2
Conclusion
- In this technical note, high throughput SDS-CGE analysis is demonstrated using the new BioPhase 8800 system and the results are compared to the single capillary PA 800 Plus pharmaceutical analysis system in respect to migration time, peak area% reproducibility, resolution and throughput.
- Excellent detection linearities were obtained over 4 orders of magnitude in sample concentration range.
- (NIST mAb), resulting in 2.4 μg/mL and 4 ng/mL LOD, and 4.9 μg/mL and 10 ng/mL LOQ, with the use of UV and LIF detectors, respectively.
- Impurity analysis down to the 0.1% level was demonstrated.
- Good correlation with the conditions of the current PA 800 Plus system makes the method transition from a single capillary to a multi-capillary format easy.
- The multi-capillary system can be used to accelerate development of sensitive, high-throughput analytical methods, potentially decreasing time to market for biologics.
References
- Runcie, K., et al., Bi-specific and tri-specific antibodies— the next big thing in solid tumor therapeutics. Mol Med, 2018. 24(1): p. 50.
- Steeland, S., R.E. Vandenbroucke, and C. Libert, Nanobodies as therapeutics: big opportunities for small antibodies. Drug Discov Today, 2016. 21(7): p. 1076-113.
- Onuora, S., Engineered fusion protein disrupts CD40 signalling. Nat Rev Rheumatol, 2019. 15(7): p. 385.
- Sanger-van de Griend, C.E., CE-SDS method development, validation, and best practice-An overview. Electrophoresis, 2019.
- Liu, Y., et al., Methods and compositions for capillary electrophoresis (CE). 2003.
- Beckman, J., et al., Purity Determination by Capillary Electrophoresis Sodium Hexadecyl Sulfate (CE-SHS): A Novel Application For Therapeutic Protein Characterization.
- Anal Chem, 2018. 90(4): p. 2542-2547.
- Filep, C. and A. Guttman, The Effect of Temperature in Sodium Dodecyl Sulfate Capillary Gel Electrophoresis of Protein Therapeutics. Anal Chem, 2020. 92(5): p. 4023-4028.
- Guttman, A., On the separation mechanism of capillary sodium dodecyl sulfate-gel electrophoresis of proteins. Electrophoresis, 1995. 16(4): p. 611-6.
- Rediscover the strengths of your PA 800 Plus - a multi-attribute protein analyzer. SCIEX technical note, RUO-MKT-02-8608-A.