A new approach for high-resolution full and empty AAV capsid analysis utilizing a high-throughput method for comprehensive AAV evaluation on a single CE platform
Featuring the BioPhase 8800 system
Jane Luo, Tingting Li, Sahana Mollah, and Elliott Jones
SCIEX, USA
Introduction
To ensure the safety and efficacy of gene therapies delivered by adeno-associated virus (AAV) vectors, multiple critical quality attributes (CQAs) must be well characterized before regulatory submission.1 Different analytical platforms are currently being used to characterize multiple CQAs. However, these methods have limitations or cannot be used to analyze all serotypes without significant optimization. In this technical note, we present an approach for high-throughput multiple CQA analysis of AAVs using a single platform: the multi-capillary BioPhase 8800 system. High-accuracy analytical data were collected in a single day for multiple CQAs, including nucleic acid loading and titer, capsid protein profile and ratio, and capsid titer from the same samples.
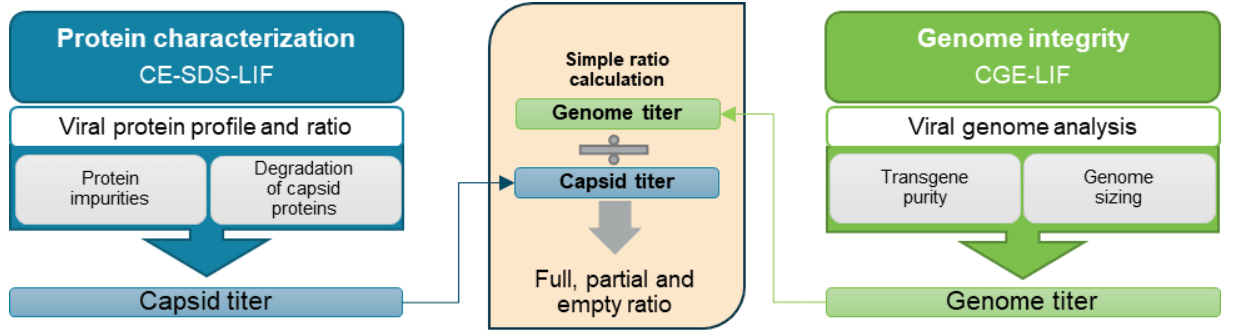
A new approach was used here to obtain empty, partial, and full capsid ratios by utilizing data for other CQAs (Figure 1). The workflow is serotype-independent and amenable for development and QC. Using a single, multi-capillary platform for multiple AAV CQA analyses saves time and cost and reduces laboratory footprint compared to using different platforms.
Key features of the comprehensive AAV characterization workflow
- High-definition full, partial, and empty analysis is accomplished with a new methodology
- High-throughput, comprehensive analysis of multiple CQAs for the same AAV sample is performed on a single platform within a single day
- High-resolution, serotype-independent capsid profile, ratio, and impurity analyses, and titer determination are achieved with a CE-SDS-LIF workflow
- High-resolution, serotype-independent genome integrity analysis and titer determination are achieved with a CGE-LIF workflow
- Multi-capillary capability enables fast result generation for all methods
- Time and cost saving, and laboratory footprint reduction are attained by using a single tabletop platform for the analysis of multiple CQAs
Figure 1. A new approach for high-resolution full and empty AAV capsid analysis as part of a high-throughput, comprehensive analysis suite of AAV CQAs on the BioPhase 8800 system. Each sample is analyzed with 2 workflows: the CE-SDS-LIF for protein characterization including the capsid titer determination; the CGE-LIF for genome integrity analysis including genome titer determination. The percentage of the full capsids is calculated by dividing the genome titer by the capsid titer.
Materials and methods
Materials: The BioPhase CE-SDS Protein Analysis kit (PN C30085), the BioPhase BFS Capillary Cartridge (PN 5080121), the BioPhase Sample and Reagent Plates (PN 5080311), the RNA 9000 Purity & Integrity kit (PN C48231) and Sample Loading Solution (SLS) (PN 608082) were from SCIEX (Framingham, MA). The Chromeo P503 dye (PN 15106) was from ACTIVE MOTIF (Carlsbad, CA). Dithiothreitol (DTT, PN V3151) was from Promega (Fitchburg, WI). QIAquick PCR purification kit (PN 28104) was from Qiagen (Germantown, MD). Single-stranded RNA ladder 0.5-9 kb (PN N0362S) was from New England BioLabs (NEB) (Ipswich, MA). Nuclease-free water (PN AM9932), 10x Phosphate Buffered Saline (PBS) (PN AM9624), and RNA 6000 Ladder (PN AM7152) were from Thermo Fisher Scientific (Waltham, MA).
Samples: The packaged AAV8 of pAV-CMV-GFP (~2.62x10¹³ GC/mL), packaged AAV8 of pAV-CMV-BuB1, and AAV8-CMVGFP reference standard with full capsids (PN RS-AAV8-FL) were from Charles River (Rockville, MD). The AAV1-CMV-GFP (PN SL100803), AAV2-CMV-GFP (PN SL100812), AAV2-CMVLacz (PN SL100854), AAV5-CMV-Lacz (PN SL100857) and AAV9-CMV-Lacz (PN SL100868) were from SignaGen Laboratories (Rockville, MD).
Instrument and software: A BioPhase 8800 system (PN 5083590) equipped with LIF detection was from SCIEX. The excitation wavelength was 488 nm, and the emission wavelength was 520 nm for AAV genome integrity analysis. A 600 nm bandpass emission filter (PN 5085177) from SCIEX was used for CE-LIF analysis of AAV capsid proteins. Data acquisition and analysis were performed using BioPhase software, version 1.0 (SCIEX).
Sample preparation for AAV capsid protein analysis by CESDS-LIF on the BioPhase 8800 system: A 20 μL sample of AAV was diluted to 1x10¹¹ GC/mL with 1x PBS. The diluted AAV sample was then mixed with 20 μL of sample buffer from the BioPhase CE-SDS Protein Analysis kit and 4 μL of 1M DTT and incubated at 70°C for 10 minutes. After samples were cooled to room temperature, 2 μL of 1 mg/mL Chromeo P503 dye was added, and the mixture was incubated at 70°C for another 10 minutes. After the samples were again cooled to room temperature, 154 μL of water was added to the mixture. AAV1, AAV2, and AAV8 samples were all prepared following the same sample preparation procedure. A 100 μL sample of the diluted, prepared solution was transferred into a sample well on the sample plate. Analysis was then performed on the BioPhase 8800 system using separation conditions described previously.2
Sample preparation for AAV capsid titer determination by CE-SDS-LIF on the BioPhase 8800 system: The packaged AAV8 of pAV-CMV-GFP (2.62 x 10¹³ GC/mL) was used as a standard and serially diluted 2-fold with 1x PBS to generate results to build a standard curve. A total of 15 serial dilutions were made with AAV concentration in a range of 2.62 x 10¹³ GC/mL to 1.60 x 10⁹ GC/mL. From each diluted standard solution, 15 μL was removed and added to 15 μL of sample buffer from the BioPhase CE-SDS Protein Analysis kit and 3 μL of 1M DTT and incubated at 70°C for 10 minutes. After the mixture was cooled to room temperature, 1.5 μL of 1 mg/mL Chromeo P503 dye was added, and the mixture was incubated at 70°C for another 10 minutes. After the samples were cooled to room temperature, 115.5 μL of nuclease-free water was added to the mixture to quench the reaction. An AAV8-CMV-GFP reference standard with full capsids from Charles River was used as the test sample, and 15 μL of it was labeled with Chromeo p503 dye as described above. Then, 90 μL of the diluted, prepared sample solution was transferred into a sample well of the sample plate for analysis on the BioPhase 8800 system. After CE separation, results were analyzed using the BioPhase 8800 software. The corrected peak area of the VP3 peak for each dilution point of the standard was plotted against the AAV titer in GC/mL to generate the standard curve. A linear equation was obtained from the standard curve. The capsid titer of the AAV test sample was determined using the corrected peak area of the VP3 peak of the test sample and the linear equation.
Sample preparation for AAV genome integrity analysis by CGE-LIF on the BioPhase 8800 system: The AAV samples were prepared following a simplified workflow for genome release and purification. First, 20 μL of each AAV sample was mixed thoroughly with the binding buffer from the QIAquick PCR purification kit. The manufacturer's instructions were followed except that the column was washed twice, and the AAV genome sample was eluted from the column using 50 μL of 10x diluted elution buffer (Buffer EB from the kit diluted with nuclease-free water). Then, 10 μL of the eluted AAV genome solution was mixed with 40 μL of nuclease-free water and 50 μL of SLS, heated at 70°C for 10 minutes, and immediately cooled on ice for 5 minutes. The final 100 µL mixture was transferred into a sample well of the sample plate. CE separation conditions were the same as described previously.3
Sample preparation for AAV genome titer determination by CGE-LIF on the BioPhase 8800 system: Packaged AAV8 of pAV-CMV-GFP (2.62 x 10¹³ GC/mL) was used as a standard and serially diluted 2-fold with 1x PBS to generate results for building a standard curve. A total of 14 serial dilutions were made with AAV concentration in a range of 2.62 x 10¹³ GC/mL to 3.20 x 10⁹ GC/mL. From each diluted standard solution, 110 μL was used for genome extraction using the QIAquick PCR purification kit, following the manufacturer's instructions, except the column was washed twice, and the AAV genome sample was eluted from the column using 50 μL of 10x diluted elution buffer. Before loading onto the instrument for analysis, 10 μL of the eluted AAV genome solution was prepared as described above. As a test sample, an AAV8-CMV-GFP reference standard with full capsids from Charles River was used for genome extraction using the QIAquick PCR purification kit, following the same process as for each standard dilution. After CE separation, results were analyzed using the BioPhase 8800 software. The corrected peak area of the intact genome peak for each dilution point of the standard was plotted against the AAV titer in GC/mL to generate the standard curve. The genome titer of the AAV test sample was determined using the corrected peak area of the intact genome peak in the test sample and the linear equation.
Calculation of the percentage of AAV full capsids: The percentage of full capsids in the test sample was determined by dividing the genome titer by the capsid titer from the same test sample and multiplying it by 100.
Analytical challenges for AAV analysis
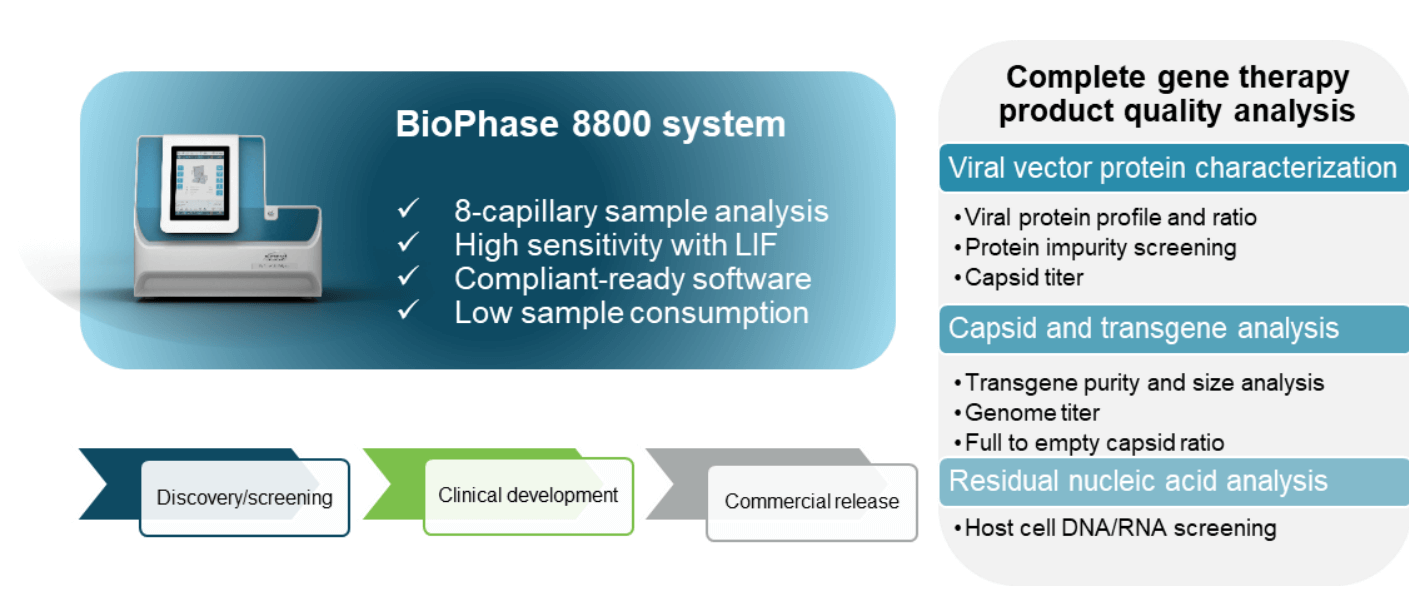
AAVs are safe and effective gene delivery vehicles to drive persistent transgene expression in gene therapy. Over 100 unique clinical trials with recombinant AAV (rAAV) vectors have been approved by US and European regulatory agencies. 1 Rapid growth in this gene therapy space created a need to manufacture rAAVs at a large scale and with high quality. Table 1 shows the reported CQAs and their potential impact on the quality of rAAVs. These CQAs must be characterized and monitored throughout the manufacturing process to ensure product efficacy and safety. The full-to-empty capsid ratio is especially important because full capsids deliver intact transgenes into target cells and directly impact the potency of AAV therapeutics. Nonfunctional empty capsids reduce transduction efficiency and might exacerbate vector-related immunotoxicity. Furthermore, partially filled capsids containing truncated genomes or fragments of host cell nucleic acids or vectors could cause low efficacy, genotoxicity, and immunotoxicity. Therefore, it is essential to use a high-resolution sizing methodology to resolve the intact genome from the partial genome and other impurities. Monitoring the full and empty capsid ratio is critical for process improvements in removing empty and partial capsids for better efficacy and safety of AAVbased gene therapy. Currently, biopharma scientists often use different platforms to analyze different CQAs. Table 2 compares current technologies to determine multiple AAV CQAs, their limitation, and the cost of each platform. The information in Table 2 indicates that comprehensive AAV analysis of multiple CQAs on different platforms is time-consuming and costly. Additionally, different laboratories are required to house different platforms and specially trained scientists are needed to run different instruments and perform data analysis using additional software. In this technical note, a single multi-capillary electrophoresis system, the BioPhase 8800 system, was utilized to provide a complete set of gene therapy product quality analysis for multiple AAV CQAs (Figure 2). Two main workflows were used. The CESDS-LIF workflow was used to analyze viral protein profile and ratio, protein impurities, and capsid titer. The CGE-LIF workflow was used for high-resolution analysis of genome integrity and genome titer. A new approach was employed to determine the percentage of full capsids by a calculation, as shown in Figure 1. Results in this technical note demonstrate that the BioPhase 8800 system provides a fast, high-throughput, comprehensive analysis of multiple AAV CQAs.
Table 1. Quality considerations for rAAV.
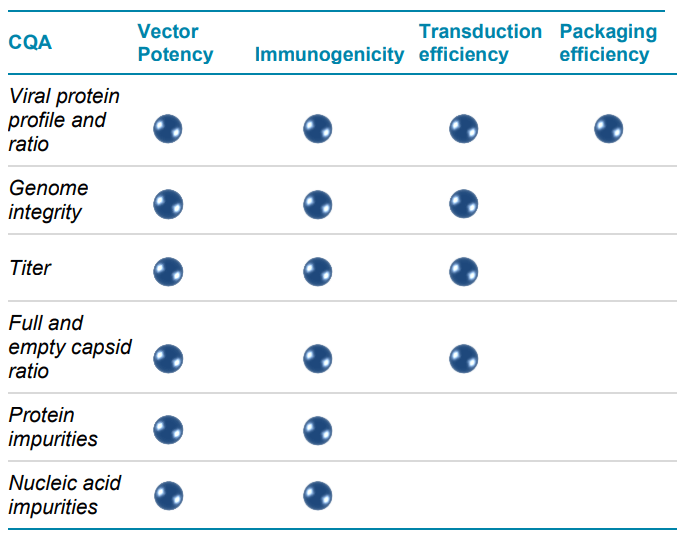
Table 2. Comparison of current technologies to determine multiple AAV CQAs. Abbreviations: ELISA: enzyme-linked immunosorbent assay; SDSPAGE: Sodium Dodecyl Sulfate-polyacrylamide gel electrophoresis; IEX: ion exchange chromatography; SEC: size exclusion chromatography; MALS: multi-angle light scattering.
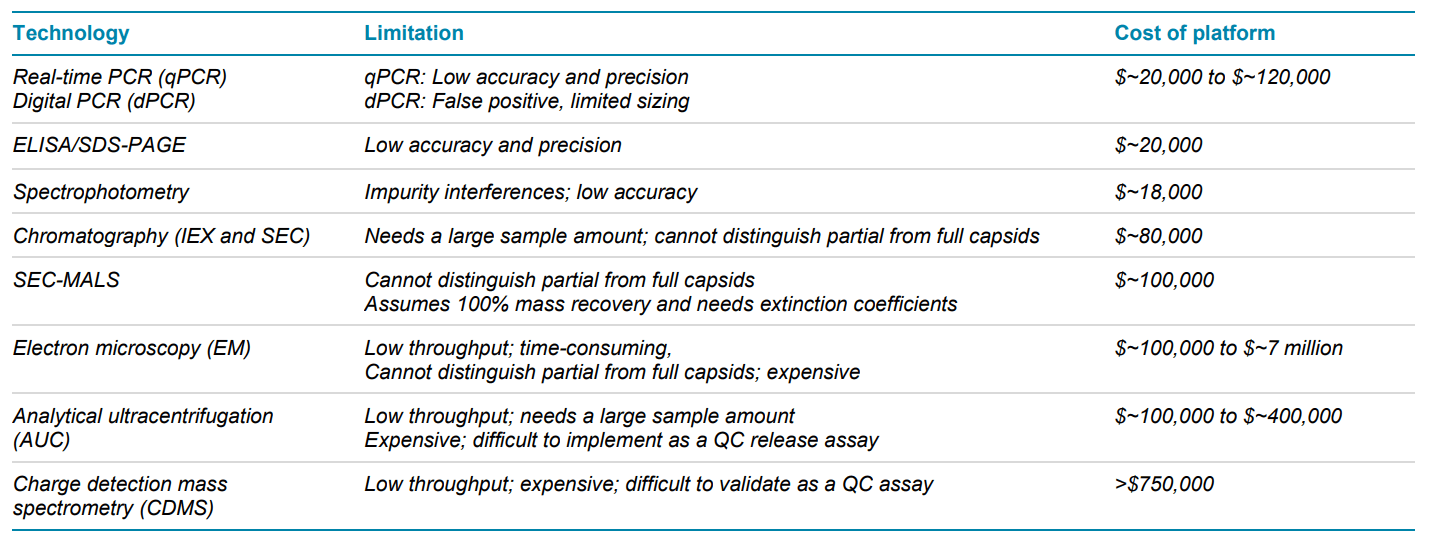
Figure 2. Comprehensive AAV analysis on the BioPhase 8800 system for key AAV CQAs. High-throughput, high-resolution sample analysis is enabled using the pre-assembled cartridge with 8 capillaries. High sensitivity is achieved with laser induced fluorescence detection or LIF. The system comes with compliant-ready software. A small sample volume is sufficient for analysis. This system offers flexible solutions designed for all phases of the drug development process including discovery, development and QC.
High-resolution AAV capsid characterization
The CE-SDS-LIF workflow shown in Figure 3 was used for highthroughput, high-resolution AAV capsid characterization. AAV samples were denatured in the presence of DTT and the sample buffer from the BioPhase CE-SDS protein analysis kit, then labeled with Chromeo p503 dye, and further separated on the BioPhase 8800 system using a BioPhase BFS capillary cartridge. As shown in Figure 4, baseline resolution was achieved in separating VP1, VP2, and VP3 peaks for AAV samples of 3 different serotypes: AAV1, AAV2, and AAV8. These peaks were also well-separated from impurities. Furthermore, baseline resolution was achieved in separating the VP3' (VP3 variant) peak from the VP3 peak for all 3 serotypes. These results indicate that the CE-SDS-LIF workflow works for all 3 serotypes and is a serotype-independent workflow. The VP3' and VP3 peaks differ by 8 amino acids due to their difference in translation start site, as reported previously.4 The baseline resolution between VP3 and VP3' peaks demonstrates the outstanding resolving power of CE on the BioPhase 8800 system.
Figure 3. High-throughput, high-resolution CE-SDS-LIF workflow for AAV capsid characterization on the BioPhase 8800 system. Samples were denatured in the presence of SDS, labeled with a fluorescent dye, and separated by CE with LIF detection to achieve high sensitivity. Data were collected and analyzed automatically. Three viral capsid proteins and the VP3 variant peaks were well-separated for easy assessment of their ratio.
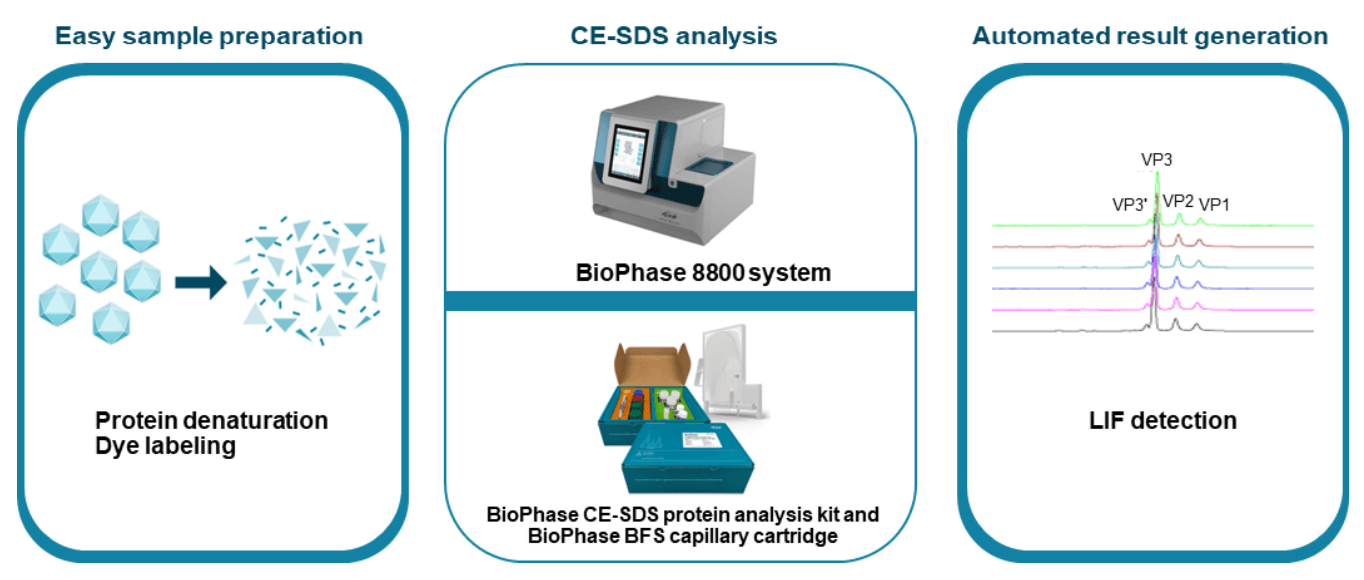
Figure 4. Analysis of capsid proteins from AAV samples of different serotypes using the same CE-SDS-LIF workflow. Samples of 3 different serotypes, AAV1, AAV2, and AAV8 were analyzed on the BioPhase 8800 system. Baseline resolution of VP1, VP2, VP3 and VP3' was achieved for all 3 serotypes. The presence of impurities were detected as well. These results demonstrate that this workflow is serotype-independent.
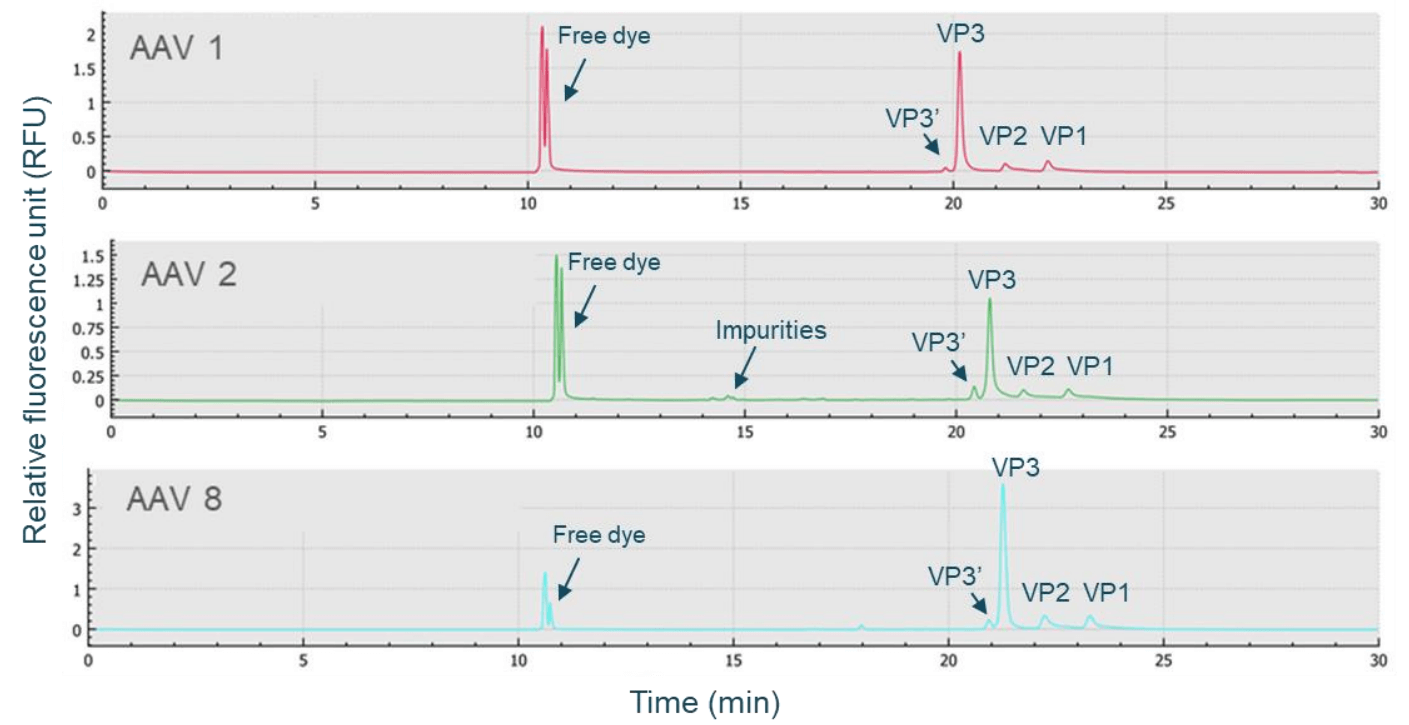
Figure 5. Fast, high-throughput AAV capsid titer determination using the CE-SDS-LIF workflow on the BioPhase 8800 system. The panel on the left is the overlay of electropherograms obtained with samples from different dilution points. The panel on the right is the plot of the corrected peak area of VP3 against the AAV titer in GC/mL with excellent linearity. The LOD was 1.60x10⁹ GC/mL. The LOQ was 6.40x10⁹ GC/mL. The linear detection range was 6.40x10⁹ GC/mL to 2.62x10¹³ GC/mL.
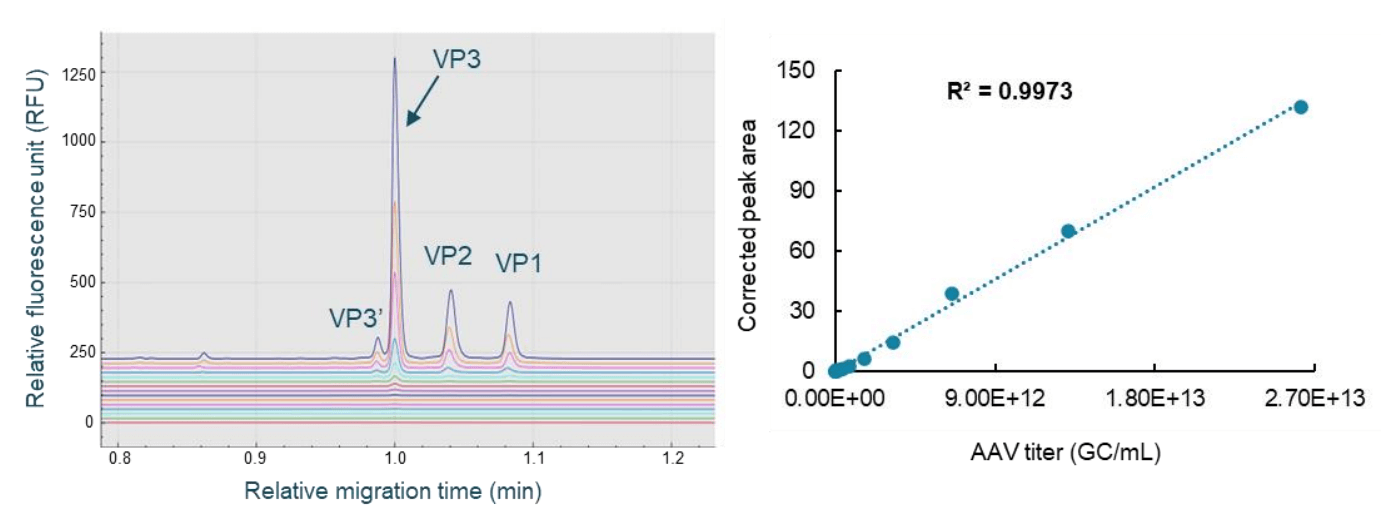
Figure 6. High-throughput, high-resolution CGE-LIF workflow for AAV genome integrity analysis on the BioPhase 8800 system. Two sample preparation options can be used. AAV samples can be treated with nuclease prior to nucleic acid extraction for analysis of product-related impurities. Alternatively, nucleic acids can be released and purified directly from the AAV samples without nuclease treatment for analysis of both product and process related impurities. Extracted nucleic acids were analyzed by CGE-LIF with the use of a fluorescent dye, SYBRTM Green II Gel Stain*, for high sensitivity analysis. The intact genome was well separated from partial genome and other impurities.
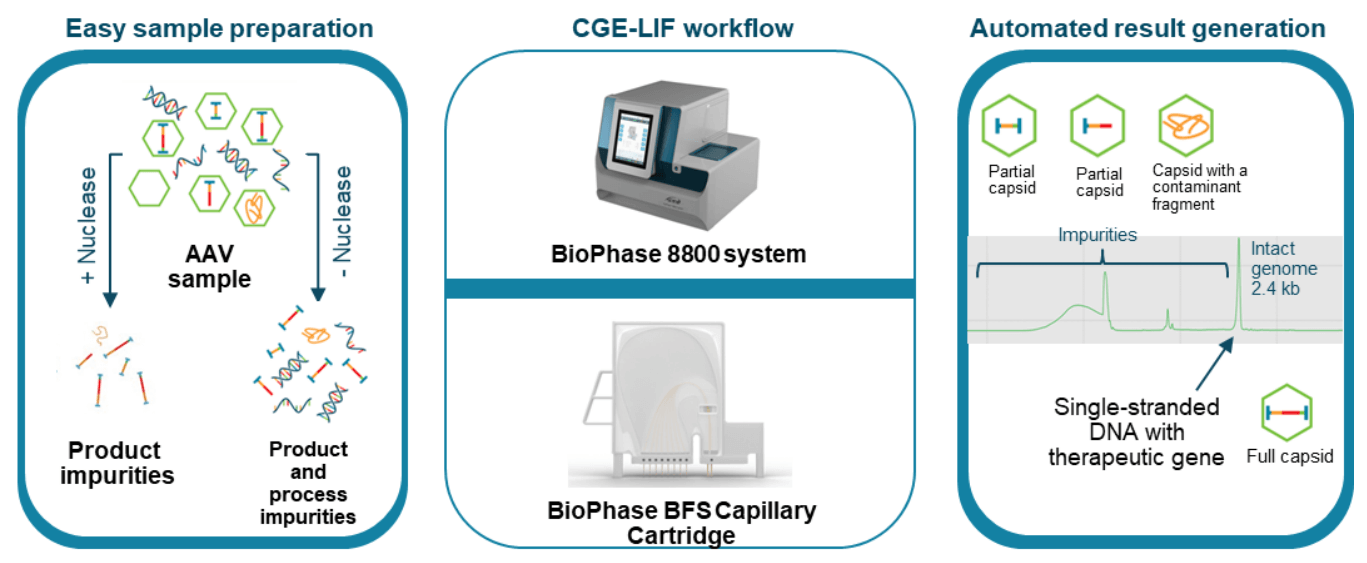
Figure 7. High-resolution genome integrity analysis on the BioPhase 8800 system. The intact genome of 2.4 kb was well separated from potential partial genomes, contaminant fragments, small-sized host cell RNA, and host cell DNA impurities.
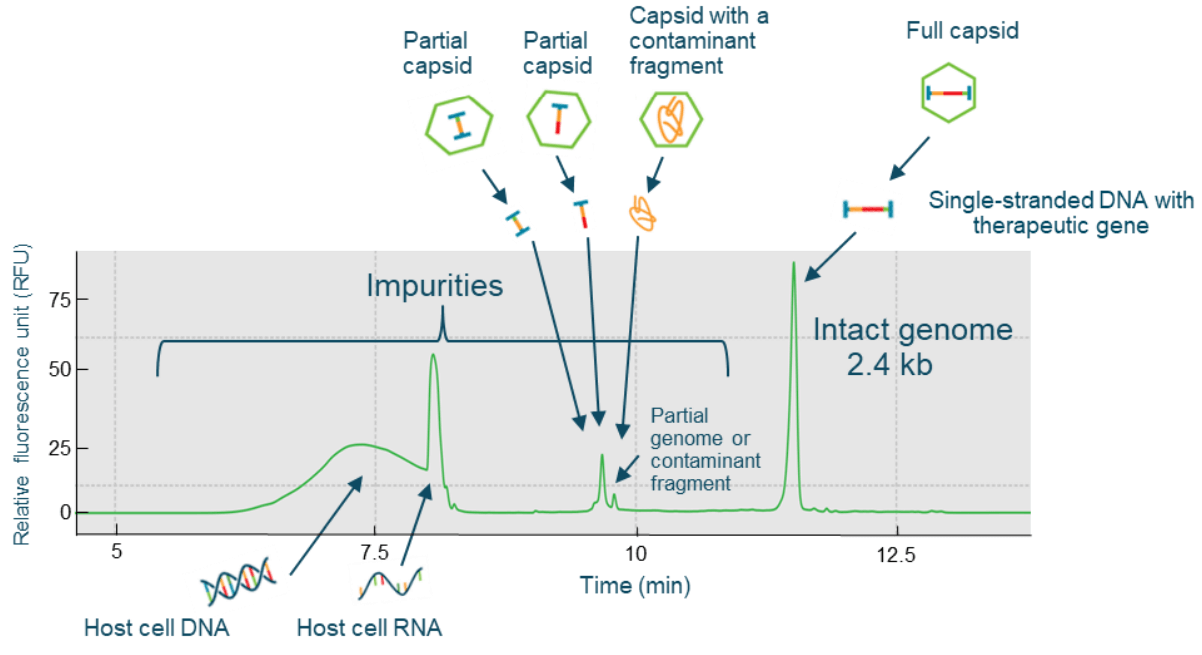
Figure 8. High-throughput, high-resolution genome integrity analysis of multiple AAV serotypes using the CGE-LIF workflow on the BioPhase 8800 system. Nucleic acids extracted from 4 different serotypes, AAV2, AAV5, AAV8, and AAV9 were analyzed. High-resolution separation of the intact genome from impurities was achieved for all 4 serotypes, demonstrating that this workflow can be implemented independent of serotype.
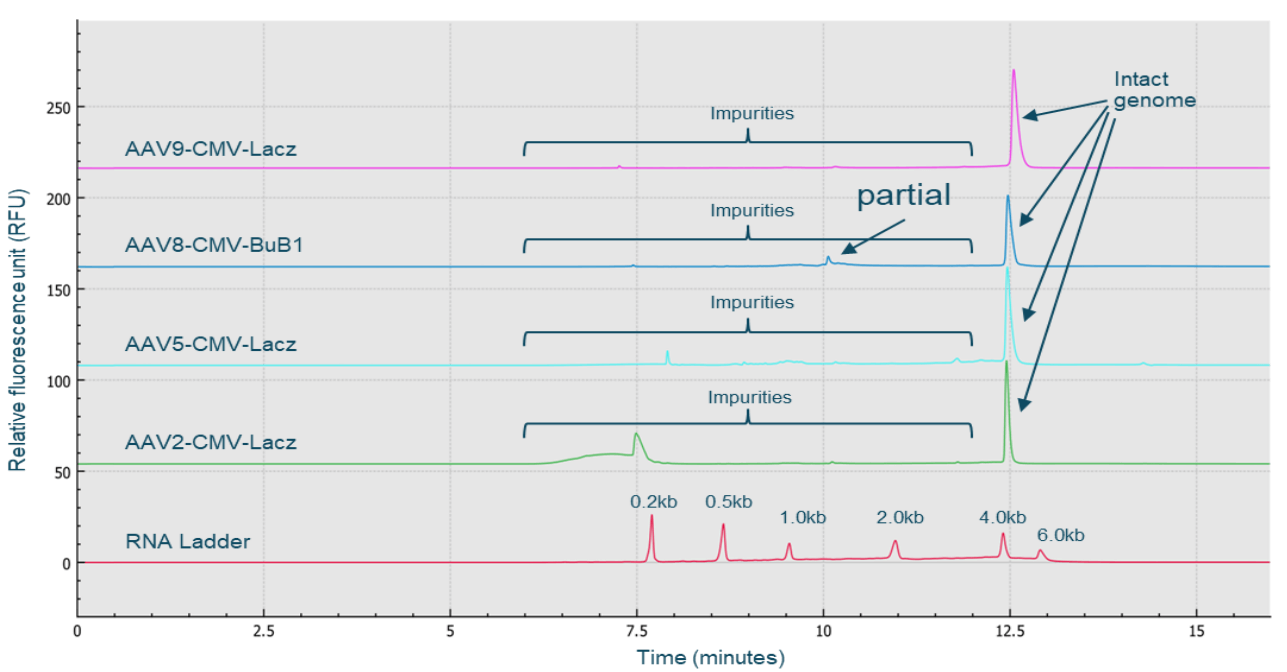
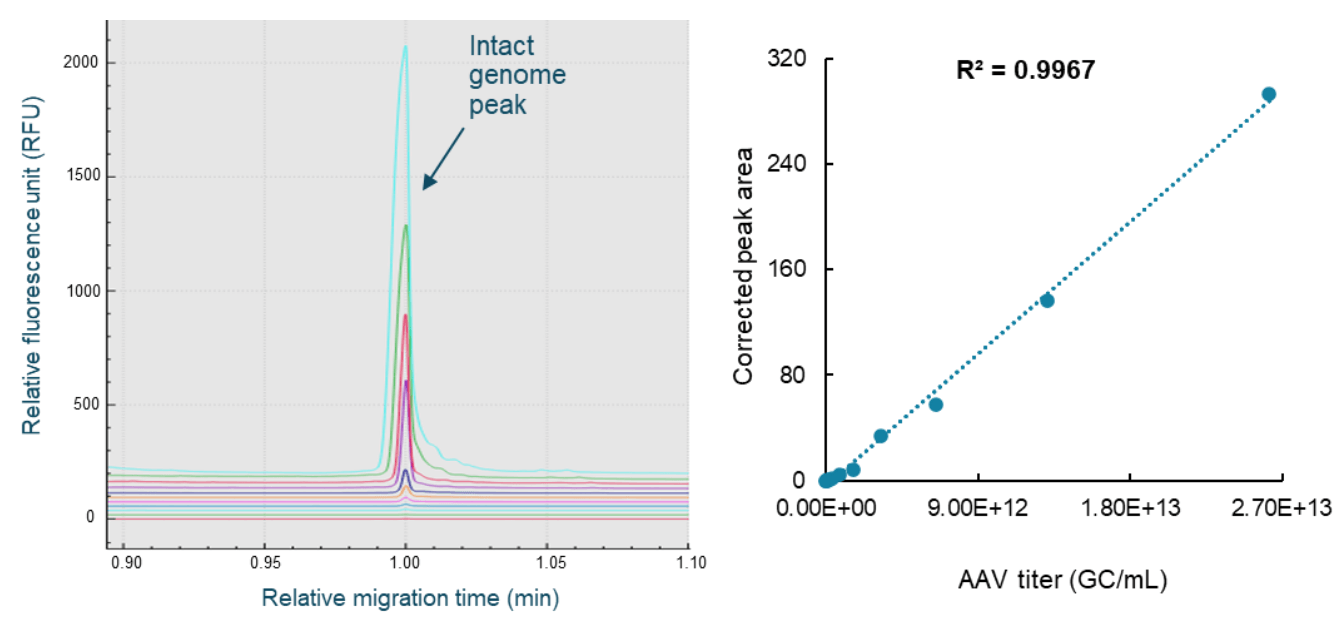
Figure 9. Fast, high-throughput AAV genome titer determination using the CGE-LIF workflow on the BioPhase 8800 system. The panel on the left shows the overlay of electropherograms obtained with samples from different dilution points. The panel on the right shows the linear plot of the corrected peak area of the intact genome peak against the AAV titer in GC/mL. The LOD was 1.28x10¹⁰ GC/mL. The LOQ was 2.56x10¹⁰ GC/mL. The linear detection range was 2.56x10¹⁰ GC/mL to 2.62x10¹³ GC/mL.
Fast, high-throughput AAV capsid titer determination
An AAV8 sample with a known titer was used as the standard. It was serially diluted 2-fold for 15 dilutions with 1x PBS buffer. Sample from each dilution point was denatured in the presence of DTT and the sample buffer, labeled with the Chromeo p503 dye, and separated on the BioPhase 8800 system. As shown in the left panel of Figure 5, baseline resolution was obtained for VP1, VP2, VP3, and VP3' peaks. The Optimizer feature on the "Integration" tab in the BioPhase 8800 software was enabled to select a best-fit analysis automatically. After minor adjustments to peak integration parameters, results were exported for simple processing in Microsoft Excel. The corrected peak area for the VP3 peak was plotted against the AAV titer in GC/mL. As shown in the right panel of Figure 5, excellent linear curve fitting was achieved, evidenced by an R2 value of 0.9973. The limit of detection (LOD) was 1.60 x 10⁹ GC/mL. The limit of quantification (LOQ) was 6.40x10⁹ GC/mL with a linear range of about 3 logs. A linear equation was obtained from the linear curve fitting. An AAV8 test sample was processed in the same experiment, using the same workflow as the AAV standard. The corrected peak area of the VP3 peak from this test sample was used to calculate its AAV capsid titer using the equation from this linear curve. The capsid titer for this test sample was 2.65 x 10¹² GC/mL.
High-resolution AAV genome integrity analysis
The CGE-LIF workflow shown in Figure 6 was used for highthroughput AAV genome integrity analysis. Two sample preparation options can be used. A fast method was used for the analysis of both product- and process-related impurities with direct extraction of the single-stranded DNA genome from the AAV sample using the Qiagen PCR purification kit. An optional benzonase treatment step can be used for the analysis of product-related impurities in the AAV sample. The extracted AAV genome sample was analyzed by CGE-LIF on the BioPhase 8800 system. Figure 7 shows the high-resolution results obtained with an AAV2-CMV-LacZ sample. The 2.4 kb intact genome peak was well-separated from 2 distinct peaks with sizes around 1 kb and small-sized impurities of around 0.2 kb.
The 2 distinct peaks with sizes around 1 kb could be potential partial genome peaks or contaminant fragments from the host cell genome or plasmid vectors. There are 2 groups of smallsized impurities: the one with a sharp peak shape could be host cell RNA impurities, while the broad peak could be small-sized host cell DNA fragments. Since the BioPhase BFS capillary cartridge has 8 capillaries, the same high-resolution genome integrity analysis can simultaneously be performed for up to 8 AAV samples. Figure 8 shows the results obtained with 4 different AAV samples: AAV2-CMV-LacZ, AAV5-CMV-LacZ, AAV9-CMV-LacZ and AAV8-CMV-BuB1, and the RNA ladder. High-resolution of intact genome peaks and partial and small size impurities was achieved for all 4 AAV samples. This result demonstrates that the CGE-LIF workflow on the BioPhase 8800 system is a serotype-independent workflow.
Fast, high-throughput AAV genome titer determination
The same AAV8 sample with known titer used in the aforementioned AAV capsid titer determination was also used as the standard for building the standard curve for AAV genome titer determination. The AAV8 sample was serially diluted 2-fold for 11 dilutions with 1x PBS buffer. The sample from each dilution point was subjected to nucleic acid extraction using the Qiagen PCR purification kit. The extracted nucleic acid samples were heat-treated and analyzed on the BioPhase 8800 system using the multi-capillary BioPhase BFS capillary cartridge. Samples from the 14 dilution points and a test sample were completed in 2 60-minute runs. After CE separation, results were analyzed with the BioPhase 8800 software. Results were exported. Data processing was performed in Microsoft Excel. The corrected peak area of the intact genome peak was plotted against the AAV titer of the standard (Figure 9). Excellent linearity was demonstrated by the R2 value of 0.9967. The LOD was 1.28 x 10¹⁰ GC/mL and the LOQ was 2.56 x 10¹⁰ GC/mL with a linear range of about 3 logs. The AAV genome titer of the AAV8 test sample was 2.21x10¹² GC/mL.
A new approach for AAV full, partial and empty capsid analysis
Since the capsid titer and the genome titer for the same AAV8 test sample were determined in the previous experiments, the percentage of the full capsids in this test sample was obtained by dividing the genome titer of 2.21 x 10¹² GC/mL (value A) by the capsid titer of 2.65 x 10¹² GC/mL (value B) and multiplying by 100, as shown in Figure 10. The percent of full capsids in this AAV8 sample was 83.4%. No additional experiments were needed. As shown in Figure 11, the percentage of full capsids obtained by CE was consistent with the values determined by two orthogonal technologies: transmission electron microscopy (TEM) and AUC.
Benefits of comprehensive AAV analysis of multiple CQAs on a single, multi-capillary CE system
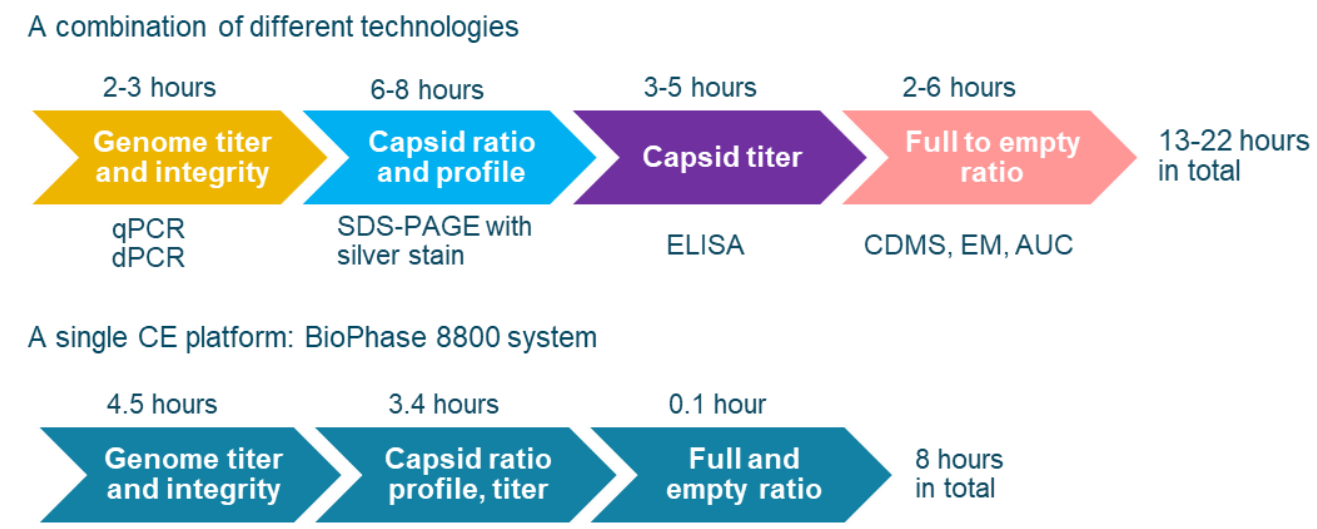
As listed in Table 1, multiple CQAs must be characterized and monitored throughout the AAV manufacturing process to ensure the efficacy and safety of AAV-based gene therapy drugs. Currently, biopharma scientists often use multiple, different platforms for the analysis of all key AAV CQAs. As shown in Figure 12, when other platforms are used, the total time for comprehensive analysis of all key AAV CQAs for an AAV sample would be 13-22 hours including sample preparation time. In addition, multiple laboratories might be needed to house instruments for different platforms. Analysts with different skill sets are also required to perform tests on different instruments. In contrast, a comprehensive analysis of all key CQAs can be done on a single platform, the BioPhase 8800 system, within 8 hours. With its tabletop design, the BioPhase 8800 system would not only save cost in equipment purchasing but also save laboratory space, enabling a streamlined quality test process with high efficiency.
Figure 10. A simple calculation for determining the percentage of full capsids in an AAV sample. The percentage of the full capsids is calculated by dividing the genome titer (value A) by the capsid titer (value B), and multiplying by 100.
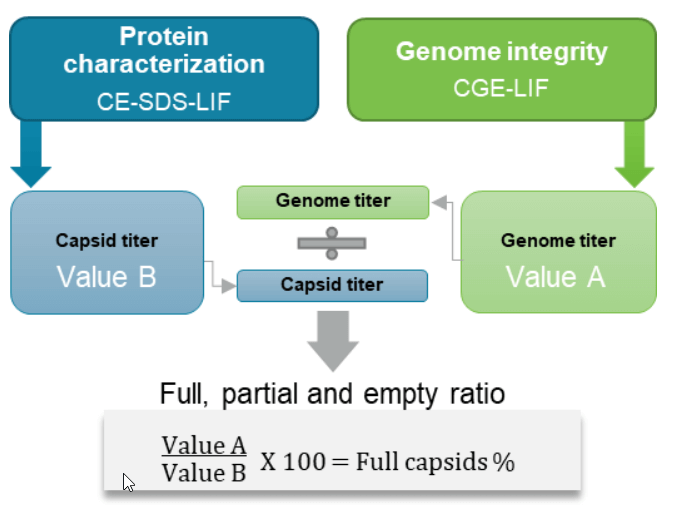
Figure 11. Comparison of the percentage of full capsids determined by three different technologies: TEM, CE, and AUC. The TEM and AUC results were obtained from the vendor of the AAV test samples.
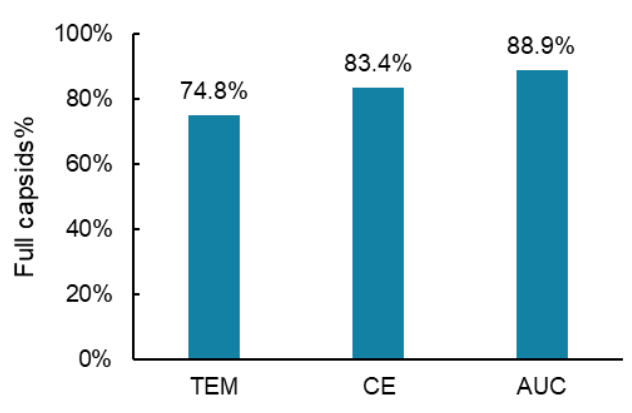
Figure 12. Comparison of the timeline for analysis of all key AAV CQAs per sample between different methods. Time for sample preparation is included. When a combination of 4 different technologies is used, the total amount of time needed for all analyses is 13 to 22 hours.5-6 However, the same number of CQAs can be analyzed on the BioPhase 8800 system in 8 hours. Therefore, using the BioPhase 8800 system saves significant time compared to an approach using a combination of different platforms.
Conclusion
- It is essential to characterize and monitor multiple CQAs to ensure the safety and efficacy of AAV drug products
- High-throughput, serotype-independent, comprehensive analysis of all key CQAs for the same AAV sample was achieved on a single CE platform within a single day
- Fast result generation for all methods was accomplished using the multi-capillary cartridge, saving time and costs
- High-resolution full, partial, and empty capsid analysis as part of a comprehensive set of analytical methods for AAV was achieved on the BioPhase 8800 system
- High-resolution, high-throughput gene therapy platform method development from discovery through quality control (QC) can all be carried out on the BioPhase 8800 system
- Platform methods on the BioPhase 8800 system with fast process times can shorten development timelines, save cost, streamline the QC process and accelerate time to market
References
- AAV manufacturing for clinical use: Insights on current challenges from the upstream process perspective. (2021) Current opinion in biomedical engineering. 20:100353.
- Acceleration of method optimization for AAV capsid purity analysis using multi-capillary electrophoresis platform. SCIEX technical note, RUO-MKT-02-13368-B.
- Genome integrity analysis of adeno-associated viruses (AAV) using multi-capillary gel electrophoresis. SCIEX technical note, RUO-MKT-02-13572-A.
- Characterization of adeno-associated virus capsid proteins with two types of VP3-related components by capillary gel electrophoresis and mass spectrometry. (2021) Human gene therapy. 32(21–22):1403-1416.
- Analytical methods for process and product characterization of recombinant adeno-associated virus-based gene therapies. (2021) Mol Ther Methods Clin Dev 20:740-754.
- Analysis of recombinant adeno-associated virus (rAAV) purity using silver-stained SDS-PAGE. (2020) Cold Spring Harbor Protocols 2020(8):pdb.prot095679.