Released N-linked glycan analysis employing automated sample preparation on a Biomek i5 liquid handler
Featuring the BioPhase 8800 system and the BioPhase Fast Glycan Labeling and Analysis kit
Fang Wang1, Sudha Savant2 and Marcia Santos1
1SCIEX, USA; 2Beckman Coulter, USA
Abstract
This technical note presents a streamlined N-linked glycan analysis that employs an automated sample preparation with the magnetic bead-mediated glycan workflow followed by capillary electrophoresis (CE). The inter- and intra-capillary reproducibility results demonstrate the robustness of the assay with automated sample preparation.
Introduction
Thousands of samples, including those containing N-linked glycans, must be screened monthly in the early stages of development. Additionally, this type of profiling has become more important in other stages of development, as the number and complexity of therapeutic modalities have increased.
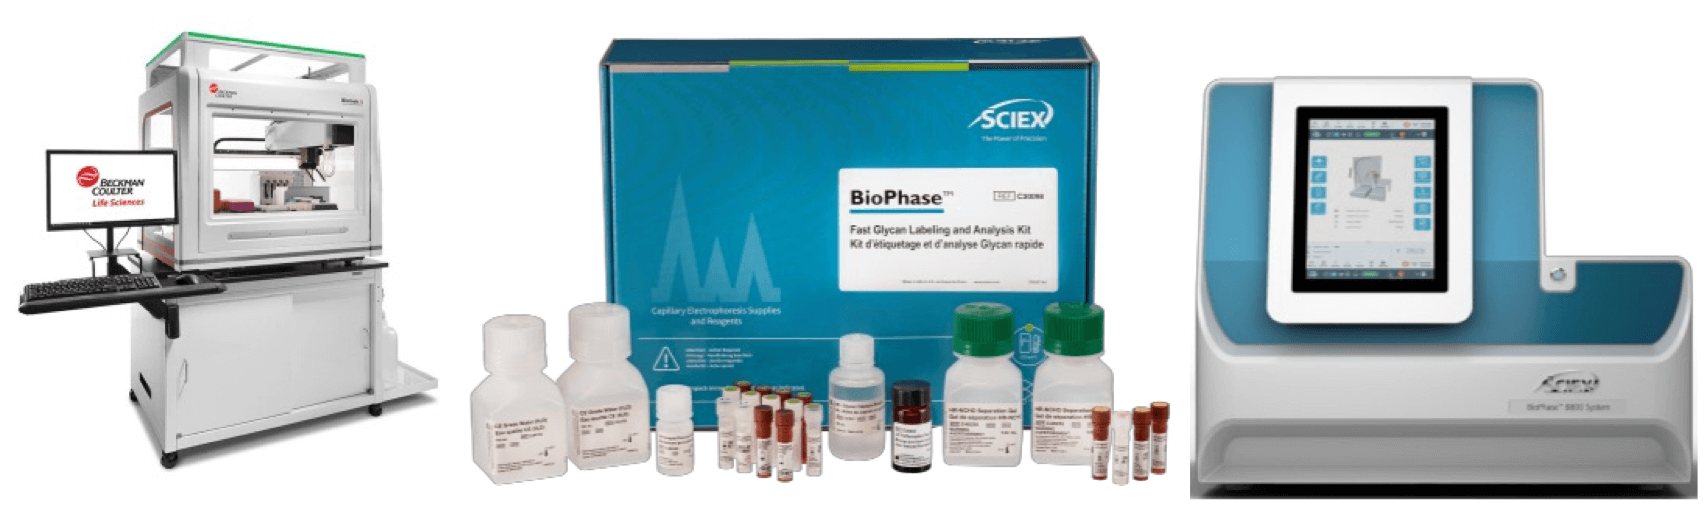
By adopting the Biomek i5 multichannel (MC) automated workstation and the multi-capillary BioPhase 8800 system with the BioPhase Fast Glycan Labeling and Analysis kit (Figure 1) and an easy-to-use data analysis software2, a high-throughput N-linked glycan analysis can be efficiently achieved. Moreover, the automated workflow can significantly reduce user exposure to chemicals and improve sample preparation reproducibility, resulting in more consistent results.
In this technical note, automated sample preparation of the release and labeling of N-linked glycans was developed and evaluated to demonstrate large-scale, reproducible screening on released N-linked glycans. The inter- and intra-capillary reproducibility results indicated that this workflow is robust, highly reliable and can significantly reduce the time needed to screen for thousands of therapeutics.
Key features of automated sample preparation for released N-linked glycan analysis
- High-throughput automated sample preparation: Less than 3 hours of hands-free preparation time was needed to prepare a 96-well plate
- Robust and reproducible analytical performance: Demonstrated ability to reach exceptional intra- and intercapillary performance and reproducibility
- Enhanced usability and sample prep flexibility: The Biomek i5 MC automated workstation features flexible configurations that increase user confidence and walk-away time
- Streamlined workflow: Automated preparation of an integrated assay, multi-channel CE data acquisition and intuitive data analysis software for rapid reporting and decision making
Figure 1. The Biomek i5 MC automated workstation (left), the BioPhase Fast Glycan Labeling and Analysis kit (center) and BioPhase 8800 system (right).
Methods
Reagents: The BioPhase Fast Glycan Labeling and Analysis kit (P/N: C30098) was from SCIEX (Framingham, MA). Acetonitrile was Burdick-Jackson brand purchased from Sigma-Aldrich (St. Louis, MO). The human serum IgG (hu IgG) sample, 2-picolineborane (pic-BH3) and DMSO were from Sigma-Aldrich (St. Louis, MO). PNGase F was obtained from New England Biolabs (Boston, MA). The reagents used to prepare the denaturation, digestion and labeling solutions were provided in the BioPhase Fast Glycan Labeling and Analysis kit.
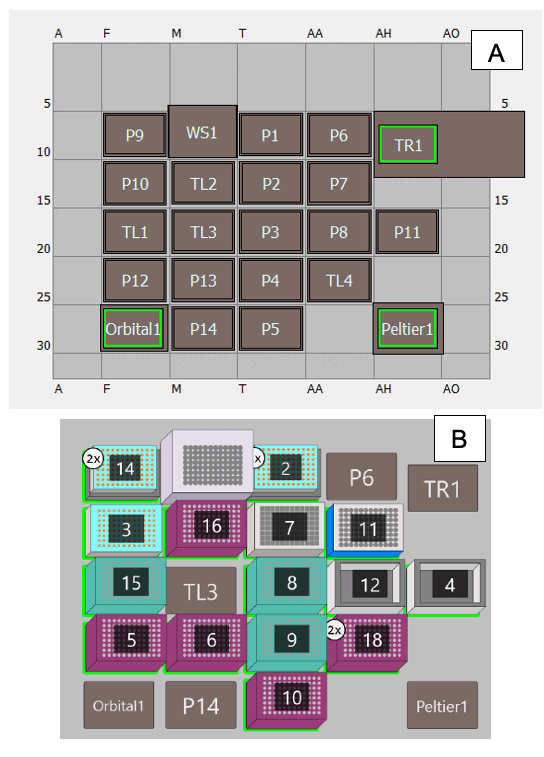
Liquid handler for sample preparation: The Biomek i5 MC automated workstation from Beckman Coulter Life Sciences (Indianapolis, IN) was set up with 96-well plate holders, a 96-well plate magnet and stand and 230 µL and 90 µL pipette tips and holders. The Biomek i5 MC automated workstation was also equipped with a 300 µL 96 pipetting head, heat block (Peltier1), orbital shaker, trash (TR1) and tip washing station (WS1). Biomek control software, version 5.1 (Beckman Coulter Life Sciences) was used. Figure 2 illustrates the deck setup of the Biomek i5 MC automated workstation. The labware and other consumables used in this work are presented in Tables 1 and 2.
Figure 2. (A) Deck layout and (B) labware organization of the Biomek i5 MC workstation.
Appendix 1 provides a step-by-step guide for sample preparation.
Table 1. Accessories required for the automated sample preparation using the Biomek i5 MC workstation.
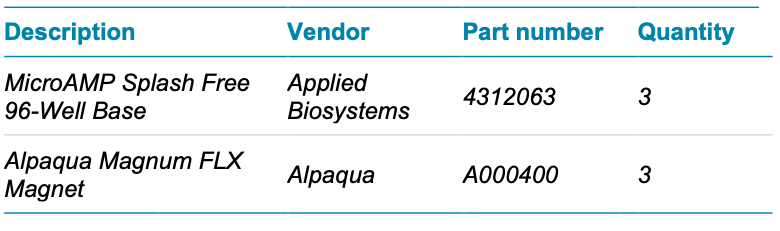
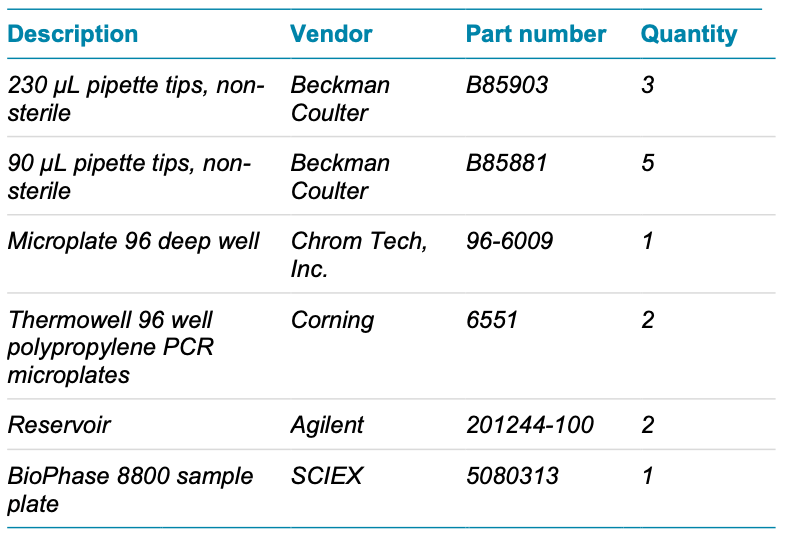
Table 2. List of pipette tips and plates used in this sample preparation workflow.
Capillary electrophoresis: The BioPhase 8800 system (P/N: 5083590F) was used. The separations were accomplished using the BioPhase BFS capillary cartridge - 8 x 30 cm (P/N: 5080121) and BioPhase sample, reagent and outlet plates (P/N: 5080311) that were acquired from SCIEX (Framingham, MA). N-linked glycans labeled with 9-aminopyrene-1,4,6-trisulfonic acid (APTS) were detected using laser-induced fluorescence (LIF) with excitation and emission wavelengths of 488 and 520 nm, respectively.
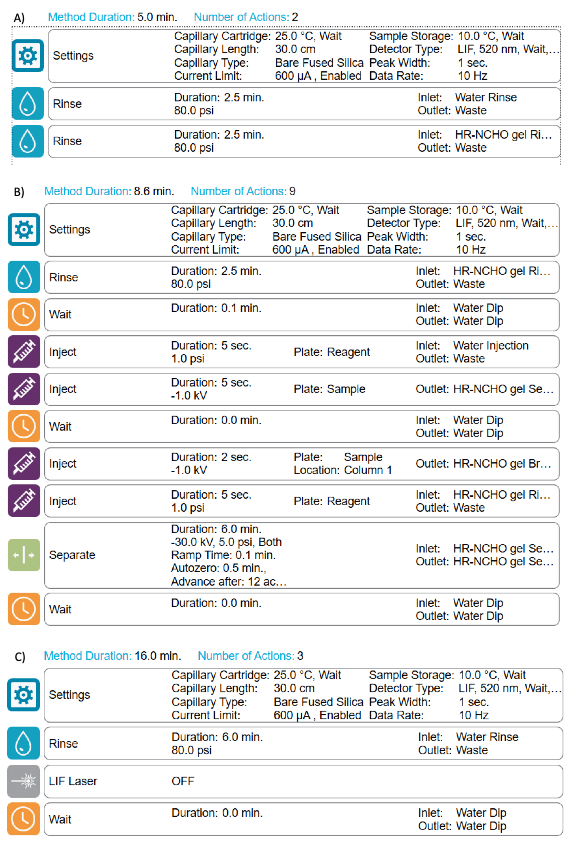
Methods and sequence: Figure 3 shows the conditioning (Figure 3A), separation (Figure 3B) and shutdown (Figure 3C) methods used for glycan analysis. A typical analysis sequence starts with the conditioning method, then the separation method is performed to analyze standards and unknown samples and finally, the sequence terminates with the shutdown method.
Data processing: The BioPhase software, version 1.2 was used to create methods and sequences and to perform data acquisition and processing.
Figure 3. BioPhase 8800 system method settings for fast glycan analysis. Conditioning method (A), separation method (B) and shutdown method (C).
Results and discussion
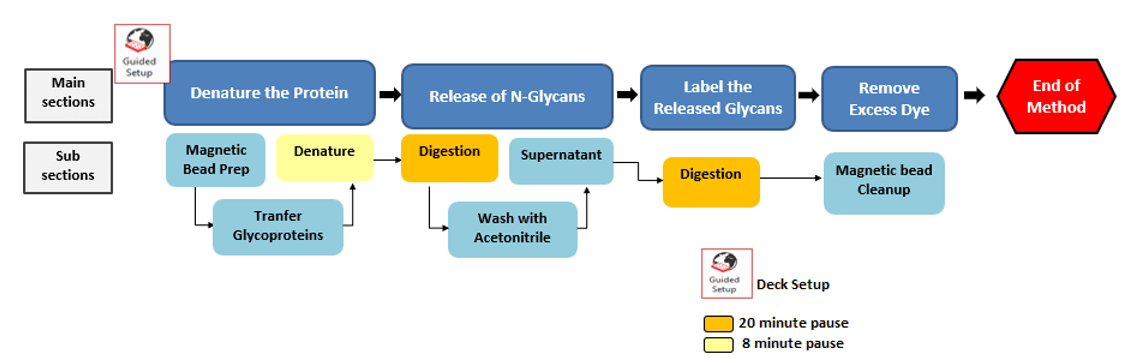
The sample preparation of N-linked glycans using the Biomek i5 MC liquid handler consists of multiple steps: 1) magnetic beadmediated digest, 2) labeling and 3) cleanup/release. Detailed sample preparation steps can be found in the Fast Glycan Labeling and Analysis kit Application Guide.3 Briefly, after mixing the sample with the magnetic beads, the sample/bead mixture undergoes denaturation and digestion with PNGase F. Then, the beads are washed with acetonitrile, which promotes glycan capture by the beads. During this wash, the deglycosylated protein is discarded. Then, the glycans undergo reductive amination with APTS and picoline borane. The reaction was not conducted in a fume hood, so picoline borane was substituted for sodium cyanoborohydride to avoid the generation of HCN. The excess APTS was removed by performing 3 acetonitrile washes. Finally, the labeled glycans were released from the beads by a final wash with distilled de-ionized (DDI) water and the sample was analyzed on the BioPhase 8800 system. The total preparation time for a 96-well plate was approximately 2 hours and 37 minutes.
Robustness of the automated sample preparation process and CE-LIF analysis
The robustness of the automated sample preparation was assessed by evaluating the intra- and inter-capillary consistency of corrected peak area percentage (CPA%), relative migration time of glucose units which is the same as the relative migration time of the glycan species (RMT GU) and glucose units (GU) for FA2G2S1/M5, FA2, M7[D1]/FA2(6)G1, FA2G2 and FA2(3)G1/FA2B(6)G1 species.
The samples used in this study were human serum IgG and negative control. In the negative control sample, the IgG was replaced with water. The negative control was used to determine any potential artifact introduced by the denaturation, digestion, glycan capture, cleanup and release processes.
The labeled N-linked glycans were placed in rows A, C, E and G of the sample plate. The negative control was placed in rows B, D, F and H.
Inter-capillary reproducibility
Figure 4 shows a bar graph that demonstrates the inter-capillary reproducibility of the CPA% for the 5 glycan species and the error bars represent the standard deviation. Accuracy in glycan peak assignment is critical and relies on the calculated GU values. Figure 5 showcases the inter-capillary reproducibility of the GU values calculated using the BioPhase software V1.2 across all 4 capillaries.
Figure 4. Inter-capillary average CPA% for each glycan species.
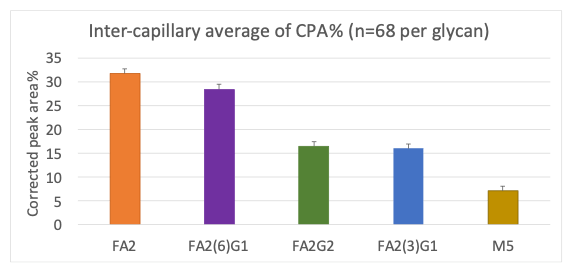
Figure 5. Inter-capillary GU value for each glycan species.
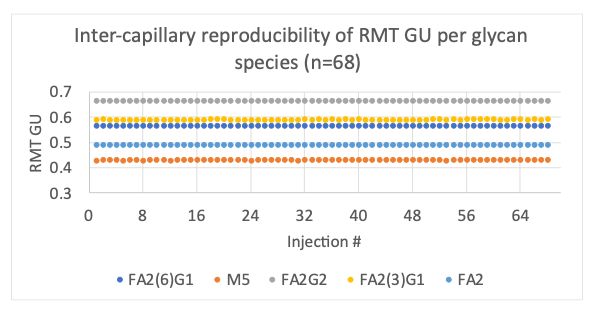
Table 3 shows the inter-capillary reproducibility in terms of R2 for CPA%, RMT GU and GU to substantiate the findings presented in Figures 4 and 5.
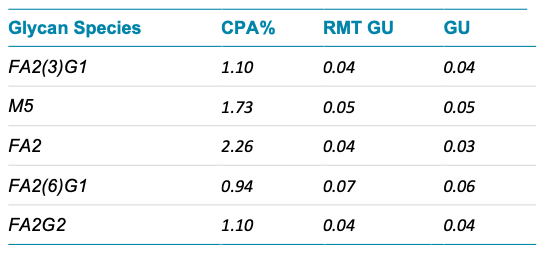
Table 3. Inter-capillary R2 for CPA%, RMT GU and GU by glycan species.
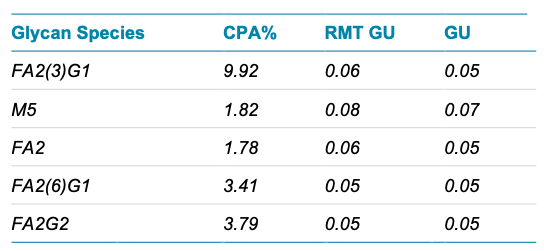
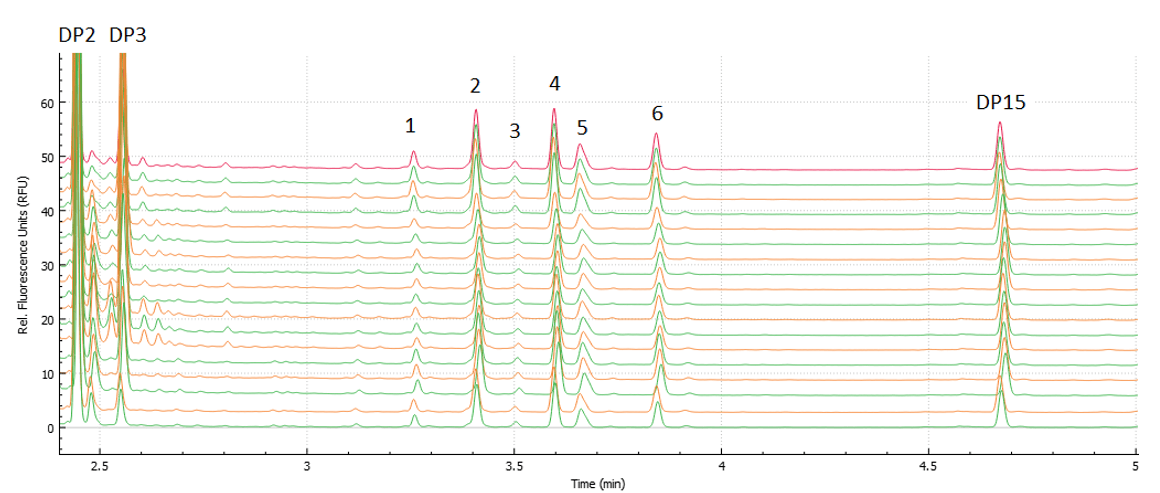
Figure 6 further illustrates the power of automated sample preparation. This figure shows a representative overlay of 17 runs obtained on capillary A to showcase the remarkable consistency in sample preparation.
Figure 6. Overlay of 17 injections of released N-linked glycans. Sample preparation and separation conditions are described in the experimental section. Peaks correspond to 1) M5, 2) FA2, 3) FA2B, 4) FA2(6)G1, 5) FA2(3)G1 and 6) FA2G2.
Intra-capillary reproducibility
The graphs from Figures 7-9 showcase the intra-capillary consistency. These results demonstrate the excellent reproducibility of each capillary and reflect the equivalence of analysis on each capillary in the cartridge.
Figure 7. Intra-capillary average of CPA%. Each bar represents data collected from a given capillary. Bars are grouped by glycan species.
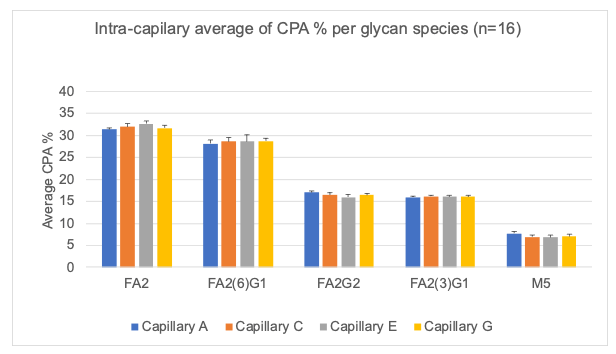
Figure 8. Intra-capillary average of RMT GU. Each bar represents data collected from a given capillary. Bars are grouped by glycan species.
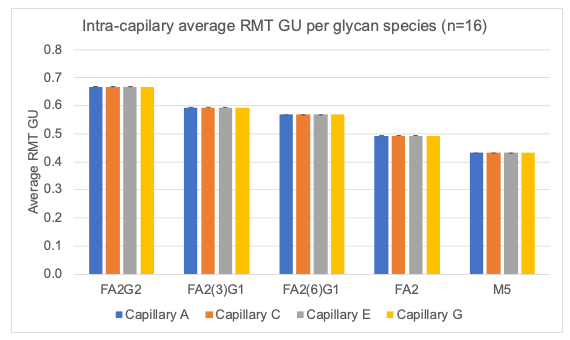
Figure 9. Intra-capillary average of GU. Each bar represents data collected from a given capillary. Bars are grouped by glycan species.
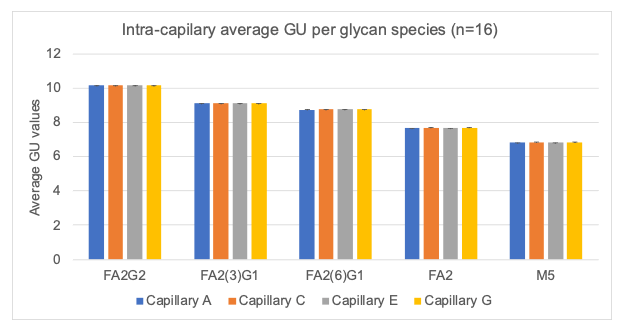
Table 4 shows the intra-capillary reproducibility in terms of R2 for CPA%, RMT GU and GU to confirm the findings presented in Figures 7-9.
Table 4. Intra-capillary R2 for CPA%, RMT GU and GU by glycan species.
Conclusion
- Robust automated sample preparation yielded excellent intracapillary reproducibility data for CPA%, RMT GU and GU
- Inter-capillary reproducibility values for CPA%, RMT GU and GU were less than 10, 0.08 and 0.07%, respectively
- Automated sample preparation eliminates labor-intensive bench work and provides a higher throughput in N-linked glycan analysis with highly consistent results
References
- Characterization of 2-AB labeled released N-linked glycans Using the X500B QTOF System. SCIEX technical note, RUO-MKT-02-9202-A
- High throughput released N-glycan identification using CE and a customizable glycan library. SCIEX technical note, MKT-26425-A
- 3. Fast glycan labeling and analysis kit for the BioPhase 8800 system application guide. SCIEX application guide, RUO-IDV-05-4648-A
Figure 10. Automated sample preparation workflow
Step by Step instructions
Step 1. Prepare the deck of the Biomek i5 MC workstation according to Figure 2B.
Step 2. Transfer 200 µL of the magnetic bead suspension into each sample well of the sample preparation plate (SPP)
Step 3. Move the SSP to the magnetic stand and wait for 90 seconds
Step 4. Aspirate supernatant to remove the storage solution from the beads
Step 5. Move the SSP to Position 1 on the deck (P1) (refer fig 2A)
Step 6. Dispense 100 µg of the antibody sample in each well
Step 7. Move the SSP to the orbital shaker and shake it for 30 seconds at 1500 rpm
Step 8. Move the SSP to position P1.
Step 9. Dispense 5µL of denaturation solution to each well
Step 10. Move the SSP to the orbital shaker and shake it for 30 seconds at 1400 rpm
Step 11. Move the SPP to the on-deck heating plate and incubate at 60°C for 8 min
Step 12. Dispense 12 µL of digestion solution to each well
Step 13. Move the SSP to orbital shaker and shake plate for 30 seconds at 1400 rpm
Step 14. Move the SPP to the on-deck heating plate and incubate at 60°C for 20 min
Step 15. Move the SPP to position P1
Step 16. Transfer 200 µL of acetonitrile into each sample well (this step will result in approximately 90% final acetonitrile concentration in the vial) for glycan capture. Use a pipette to slowly mix the sample volume up and down 5 times.
Step 17. Place the Biomek SSP onto the magnetic stand and wait for 90 seconds. Remove the supernatant (approximately 240 µL) from the sample well by carefully and slowly pipetting from the vial's bottom twice by removing small volumes. S
tep 18. Remove the Biomek SSP from the magnetic stand.
Step 19. Put the Biomek SPP on position P1.
Step 20. Add 25 µL of the previously prepared Labeling Solution into each well.
Step 21. The Biomek will move the Biomek SSP to the on-deck orbital shaker and shake it for 30 seconds at 1400 RPM.
Step 22. Move the Biomek SSP to the on-deck heat block and incubate the plate at 60°C for 20 min (Labeling Step).
Step 23. After the completion of the labeling step, the Biomek will proceed with the sample cleanup comprised of the following steps:
Step 24. Move the Biomek SSP to position P1.
Step 25. Dispense 10 µL of the reagent D4 into each well of the Biomek SPP.
Step 26. Move the Biomek SPP to the on-deck shaker and shake the plate for 30 seconds at 1400 rpm
Step 27. Move the Biomek SSP to P1
Step 28. Dispense 160 µL of Acetonitrile on to the Biomek SSP and pipette up and down at a low speed to mix the sample volume 5 times
Step 29. Move the Biomek SSP to the magnetic stand
Step 30. Wait for 180 seconds or until all beads are gathered on the walls of the wells
Step 31. Slowly pipette out approximately 180 µL of solution from Biomek SSP
Step 32. Move Biomek SSP to position P1.
Step 33. Dispense 20 µL of ddi Water onto the Biomek SSP
Step 34. Move the Biomek SSP to the on-deck shaker and shake the plate for 30 seconds at 1400 rpm
Step 35. Move the Biomek SSP to position P1
Step 36. Dispense 160 µL of Acetonitrile onto the Biomek SSP
Step 37. Pipette up and down at a low speed to mix the sample volume 5 times
Step 38. Move the Biomek SSP to the magnetic plate
Step 39. Wait for 240 seconds or until all beads are gathered on the walls of the wells
Step 40. Slowly pipette out approximately 180 µL of solution from Biomek SSP
Step 41. Move Biomek SSP to P1
Step 42. Dispense 20 µL of ddi Water onto the SPP
Step 43. Move the SPP to the on-deck shaker and shake the plate for 30 seconds at 1400 rpm
Step 44. Move the SPP to position P1
Step 45. Dispense 160 µL of acetonitrile onto the SPP
Step 46. Pipette up and down at a low speed to mix the sample volume 5 times
Step 47. Move the SPP to the magnetic stand
Step 48. Wait for 240 seconds or until all beads are gathered on the walls of the wells
Step 49. Aspirate 180 µL of solution from the SPP
Step 50. Move the SPP to position P1
Step 51. Dispense 100 µL of ddi Water onto the SPP
Step 52. Using the same pipette tip, pipette up and down at a low speed to mix the sample volume 5 times
Step 53. Move the SPP to the on-deck shaker and shake it for 30 seconds at 1400 rpm
Step 54. Move the SPP to the magnetic stand
Step 55. Wait for 240 seconds or until all beads are gathered on the walls of the wells
Step 56. Slowly pipette out approximately 95 µL of solution from the SPP
Step 57. Transfer the 95 µL eluate to the Biophase sample plate
Step 58. End of automated sample preparation method. This results in sample plate ready for CE analysis. The reaction plate for Biophase CE could be prepared manually or by automation.