Streamlined identification and quantitation of impurities of the ionizable lipid ALC-0315 for rapid and confident vendor-to-vendor raw material assessment to ensure mRNA-LNP product quality
Featuring the ZenoTOF 7600 system and ionizable lipid workflow in Molecule Profiler software
Mays Al-Dulaymi1 , Zhichang Yang2 , Sahana Mollah2 and Jonathan Le Huray3
1SCIEX, Canada; 2SCIEX USA; 3Acuitas Therapeutics Inc, Canada
Abstract
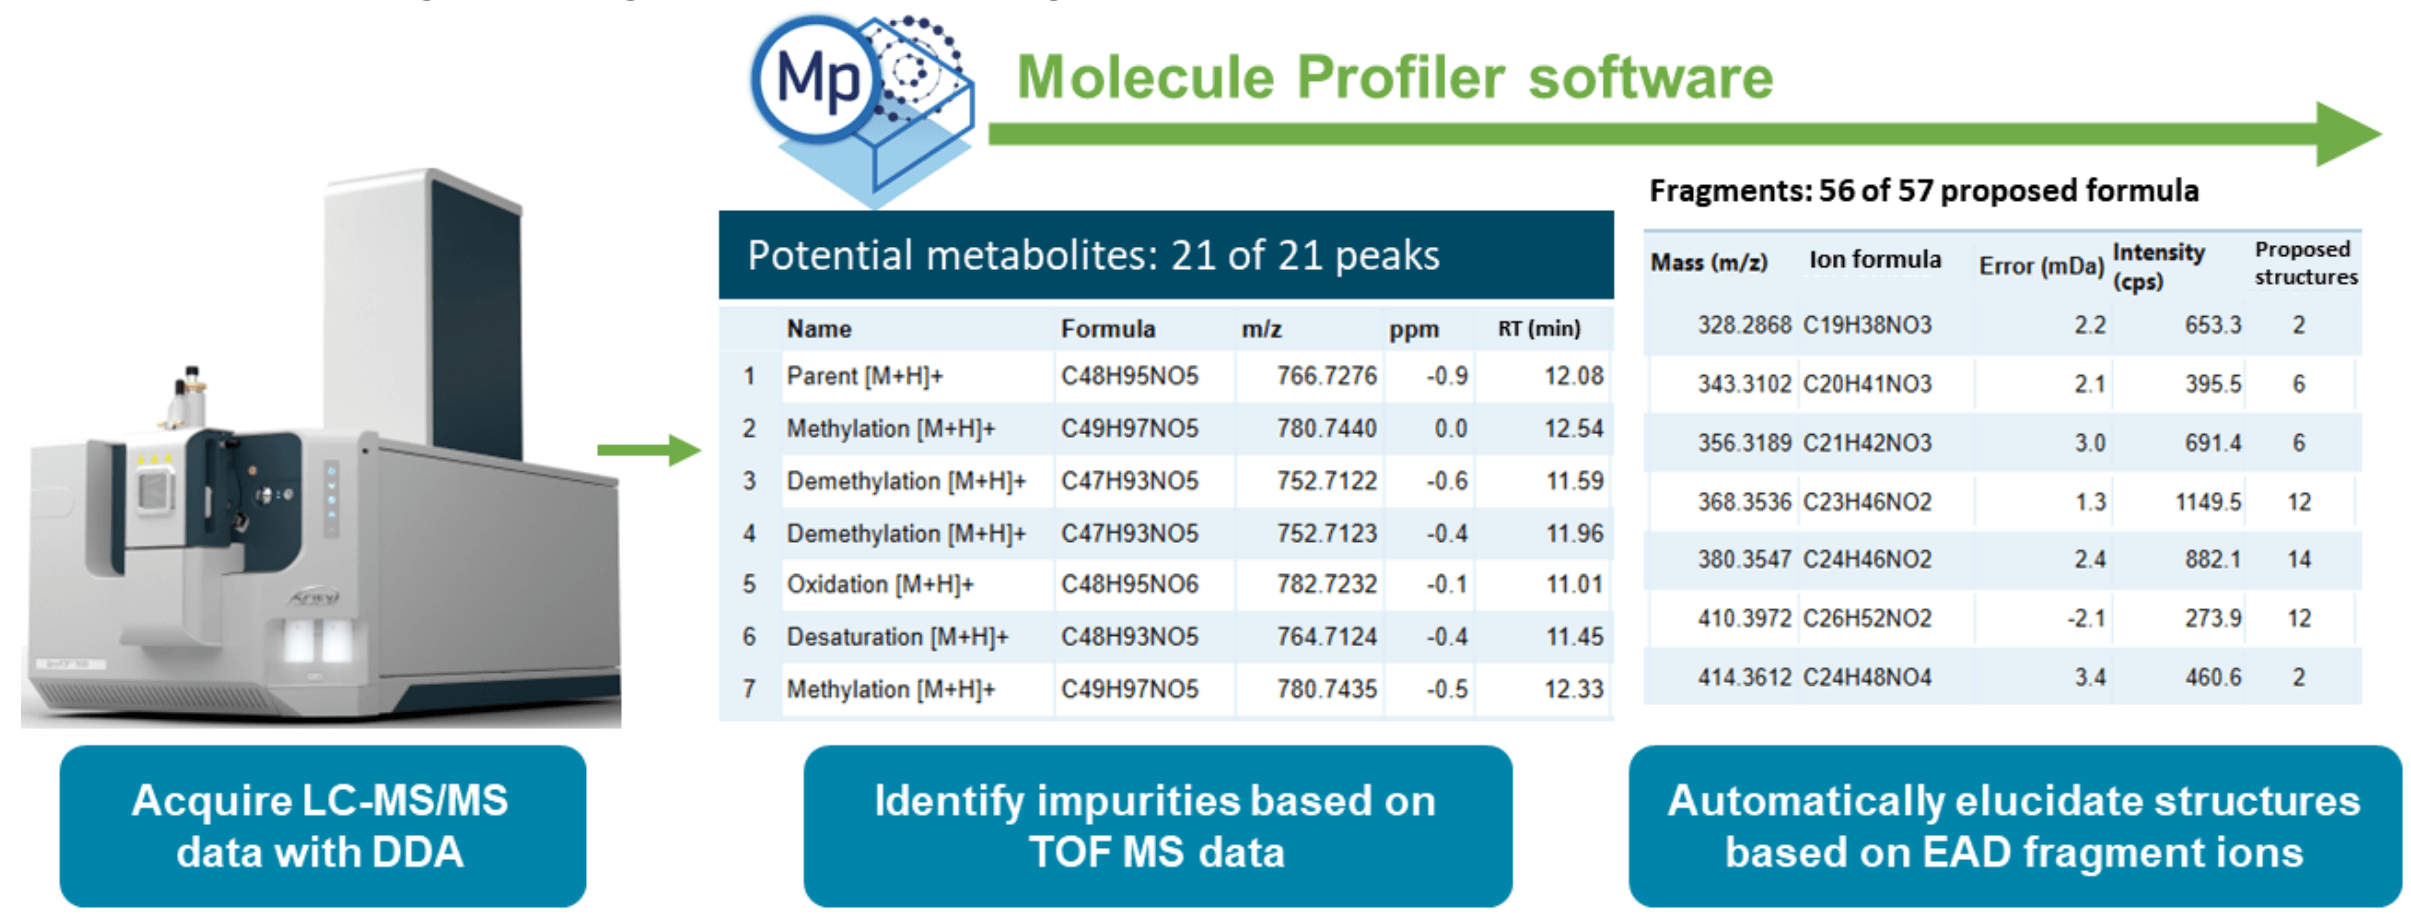
This technical note describes an automated workflow for the identification, relative quantitation and structural elucidation of impurities in the ionizable lipid, ALC-0315, sourced from 3 different vendors. This method uses the ZenoTOF 7600 system equipped with electron activated dissociation (EAD) capabilities and paired with Molecule Profiler software (Figure 1). The workflow enables users to confidently identify impurities at abundances as low as 0.01%. The workflow also allows the differentiation of unwanted impurities by in-depth structural elucidation with EAD and interpretation with Molecule Profiler software. Analytical scientists can utilize this workflow to ensure lot/vendor quality for raw materials and to increase confidence in the efficiency and safety of formulated lipid nanoparticle (LNP) products.
Introduction
The use of LNPs as a nucleic acid delivery vehicle is gaining momentum, following their use in the COVID-19 vaccines that changed the course of the SARS-CoV-2 pandemic. The purity of the lipid raw materials in LNP formulations is important because it could impact the efficacy of the resulting drug product. A recent study suggests that oxidation and subsequent hydrolysis of the tertiary amine in ionizable lipids lead to the formation of reactive species, such as N-oxide, that covalently bind to the nucleobase of mRNA and cause its loss of activity.1 Hence, a sensitive, robust and streamlined analytical workflow is required to monitor lot/vendor variability in ionizable lipids and to ensure the quality of these key raw materials. While impurity identification can rely on high-resolution mass spectrometry, confident structure confirmation requires comprehensive MS/MS spectrum annotation based on signature fragment ions. These diagnostic fragment ions are produced by EAD MS/MS using the Zeno trap to achieve high sensitivity. Traditional (Electron-transfer dissociation) ETD-based fragmentation does not work efficiently with low charge state ions that are related to lipids.2,3 The identification of these species requires (i) information-rich MS/MS data that allow for explicit structural elucidation and site-specific localization and (ii) powerful and intuitive processing software capable of overcoming time-consuming manual interpretation of highly symmetrical lipid structures. In this technical note, Molecule Profiler software leveraged the wide interscan dynamic range of the ZenoTOF 7600 system to identify impurities present in ALC0315 at concentrations as low as 0.01%. Furthermore, the software used the EAD-generated MS/MS diagnostic fragment ions to achieve automatic structure interpretation of impurities.
Figure 1. Workflow representation for the relative quantitation and structural elucidation of ALC-0315 using EAD-based MS/MS.
Key features of LNP impurity profiling
- Efficient impurity identification: Molecule Profiler software and the ZenoTOF 7600 system achieved identification of lowabundance ionizable lipid impurities (0.01%) and enabled thorough characterization of vendor-to-vendor variation
- Confident structure assignments: Comprehensive structural elucidation of ALC-0315 and its impurities was enabled by the information-rich EAD MS/MS data and the strong MS/MS spectrum interpretation ability of Molecule Profiler software
- Streamlined end-to-end solution: Sensitive and rapid data acquisition by the ZenoTOF 7600 system was accompanied by easy-to-use data analysis and automatic structural assignment using Molecule Profiler software, all integrated into SCIEX OS software
Methods
Sample preparation: Samples of ALC-0315 from 3 different suppliers were provided by Acuitas Therapeutics. Stock solutions of the 3 ionizable lipids were diluted 100-fold using mobile phase B and then were further diluted 100-fold using mobile phase A. Mobile phase B was 60:40 (v/v), acetonitrile/MeOH with 10mM ammonium acetate. Mobile phase A was a solution containing by volume 15% water, 30% MeOH and 55% acetonitrile with 10mM ammonium acetate. The resulting samples were analyzed directly by UPLC-MS/MS.
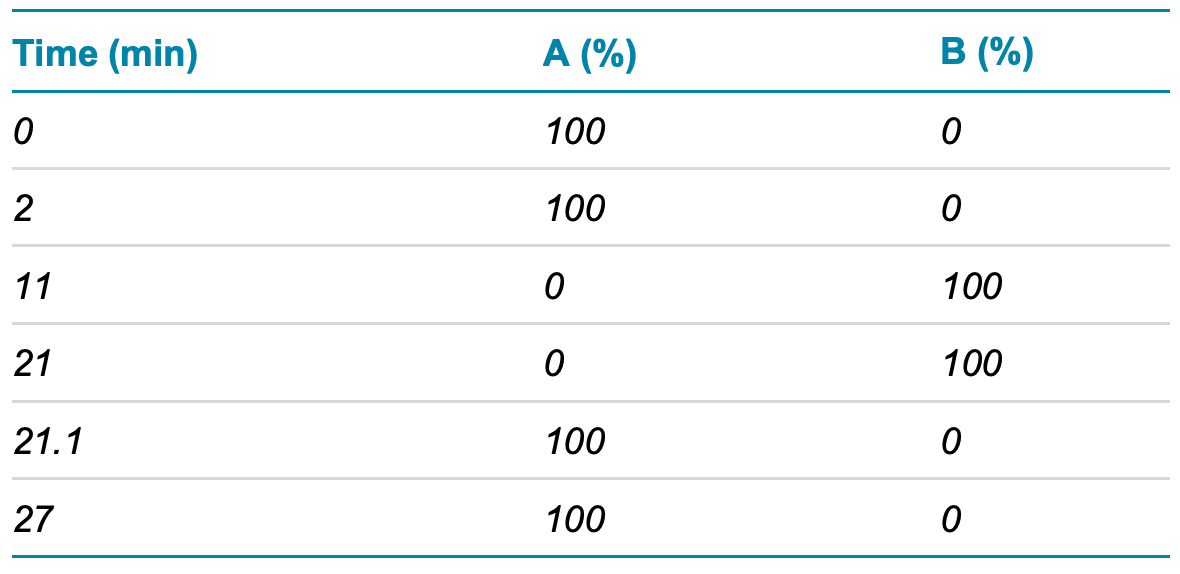
LC-MS/MS analysis: Samples were analyzed by a UPLC-ESIMS/MS system equipped with a Waters H-class UPLC system and a ZenoTOF 7600 system. The samples were separated using a UHPLC Peptide BEH C18 column (2.1 × 150 mm, 1.7 μm, 300 Å, Waters, P/N: 186003687) using the gradient conditions shown in Table 1. The flow rate was set to 0.3 mL/min and the column temperature was set to 70°C. The injection volume was set to 2 µL.
Table 1. LC gradient.
LC-MS/MS data were acquired using the data-dependent acquisition (DDA) scan mode. The parameters used in these experiments are shown in Table 2.
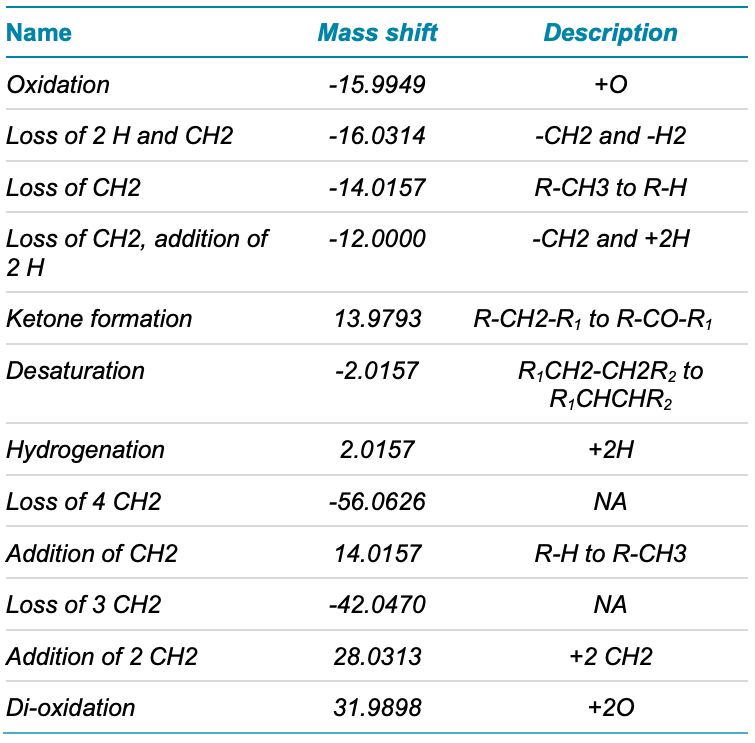
Data processing: Structural elucidation and relative quantitation were performed using the Molecule Profiler software modules of SCIEX OS software. A self-built raw material impurities list was integrated into the processing parameters (Table 3). The maximum C-C bond to break was set to 1 and the number of EAD fragment peaks selected for the assignment was set to 60 under MS/MS parameters. The rest of the parameters were set to the default.
Table 2. TOF MS and EAD MS/MS parameters.
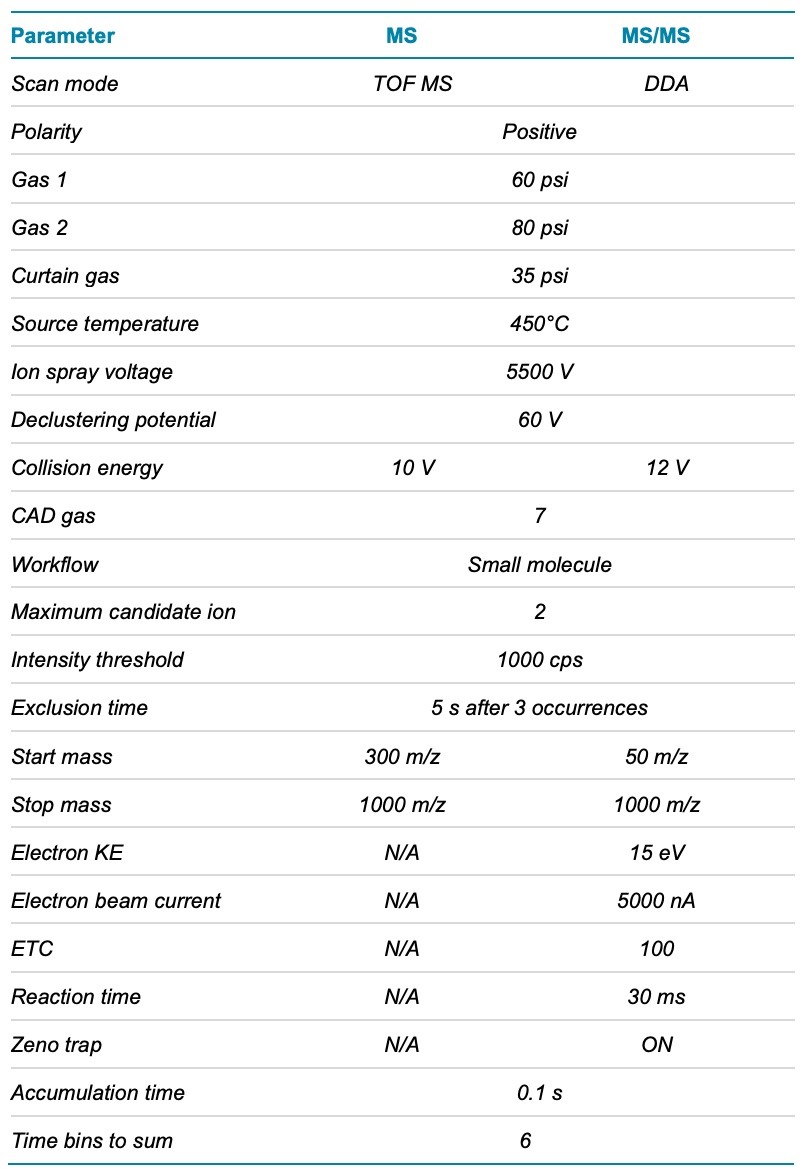
Table 3. Impurities list used in data processing parameters setting.
Purity of the ALC-0315 sample and the detection of impurities across vendors
ALC-0315 is an ionizable lipid used in the preparation of the LNPmRNA formulations for COVID-19 vaccines. In this work, ALC0315 samples from 3 different suppliers were evaluated to assess variations in their impurity profiles. A main peak of the pure ALC0315 was observed at a retention time (RT) of 12.1 min and its relative abundance varied across the 3 evaluated samples (Figure 2). The highest purity was observed in the sample from Vendor 1, with a peak area of 98.20%, followed by the samples from Vendor 3 (96.86%) and Vendor 2 (94.99%). Several low-abundance impurities, with concentrations ranging from 1.37% down to 0.01%, were detected (Figure 2), demonstrating the wide interscan dynamic range of the ZenoTOF 7600 system and the ability of Molecule Profiler software to identify low-abundance impurities.
Figure 2. Total ion chromatogram (TIC) and extracted ion chromatogram (XIC) of the main impurities in samples of ALC-0315 from 3 vendors. The TIC (A) shows the major peaks that eluted at 12.1 min, corresponding to ALC-0315. Different types and levels of impurities were observed in the XIC (B).
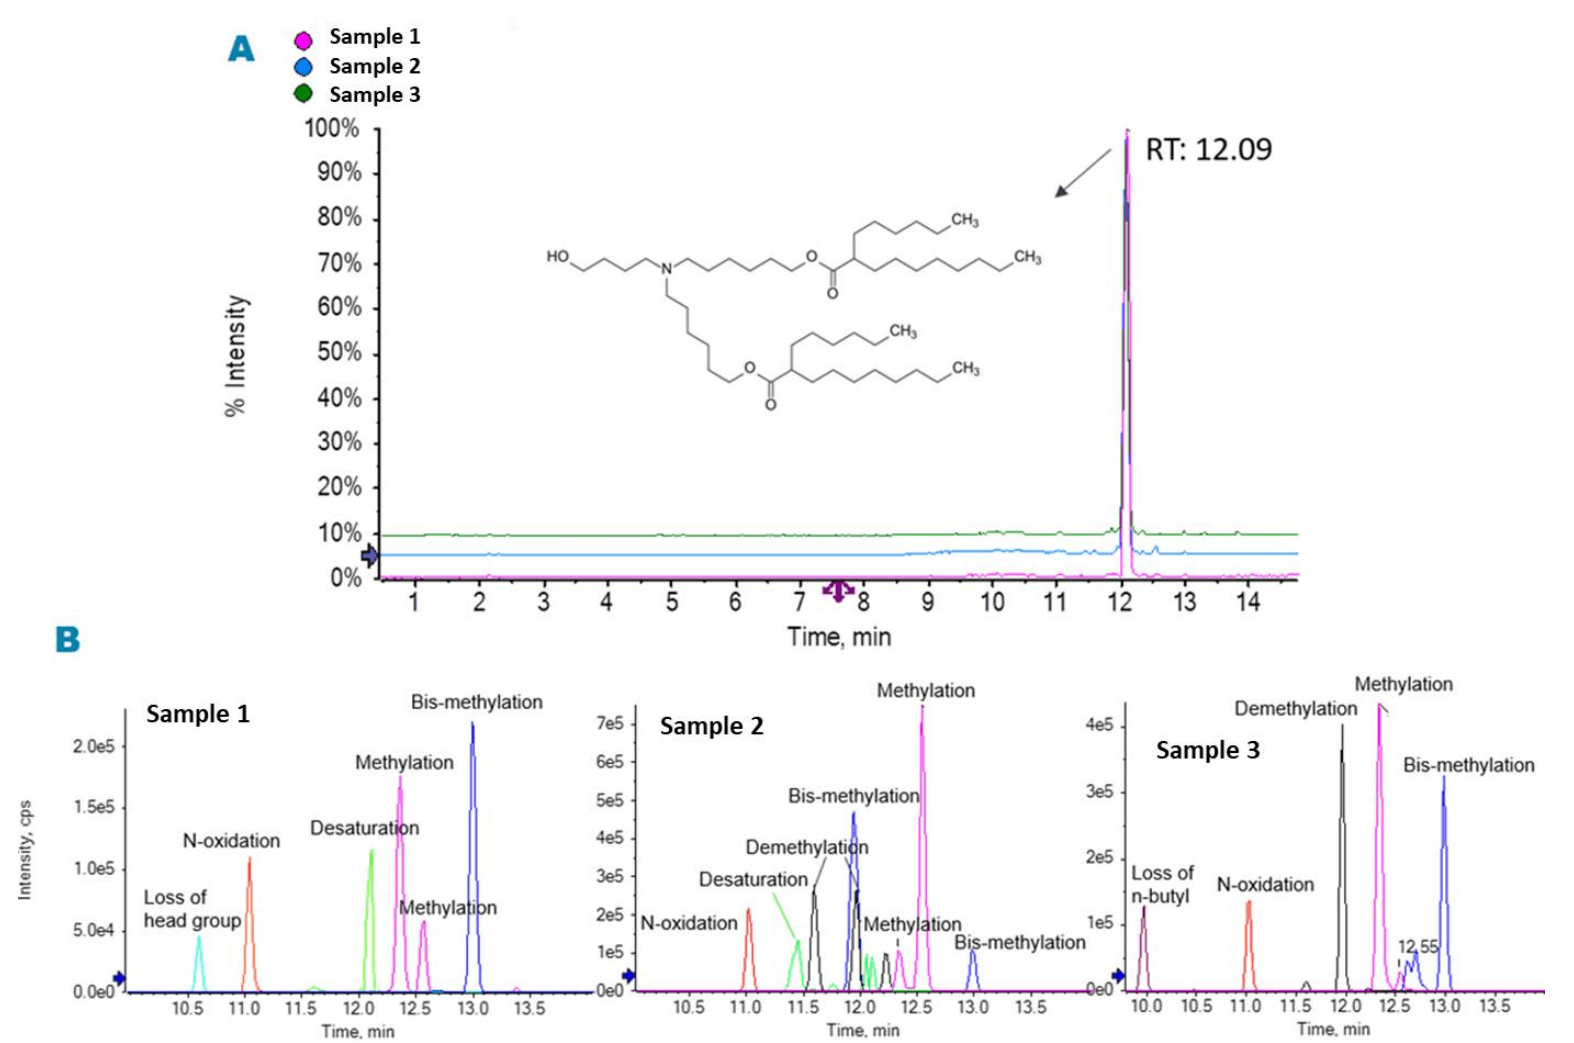
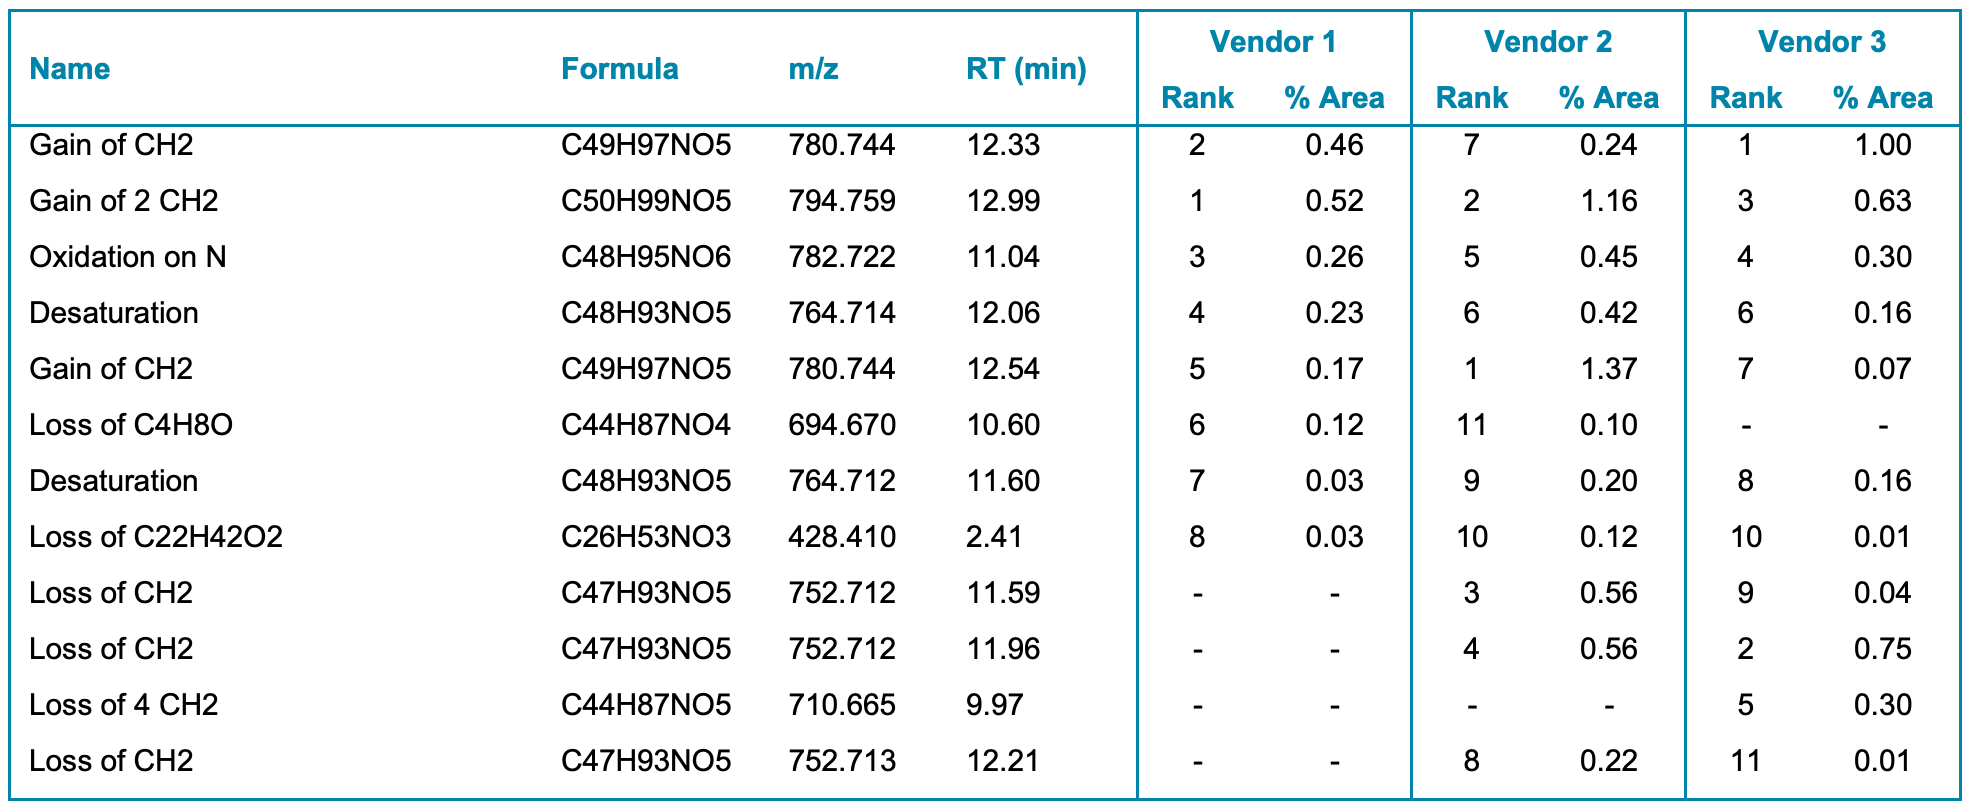
Molecule Profiler software automatically identified several impurities in samples from the 3 vendors. These results are summarized in Table 4, including their relative abundance peak areas and abundance rank within each vendor based on TOF MS peak areas. The type and abundance of impurities varied across the 3 vendors. For example, a methylated impurity eluting at RT 12.3 min showed relative abundances of 0.24%, 0.46% and 1% in the samples acquired from Vendors 2, 1 and 3, respectively. Whereas the loss of 4 CH2 was a common impurity in the sample from Vendor 3, this impurity was not observed in the samples from Vendors 1 or 2. The ability of this workflow to capture such variation in impurity content between the samples will provide a streamlined solution for lipid raw material control.
The high resolution of the ZenoTOF 7600 system allowed for excellent mass accuracy for MS and MS/MS data. Analyzed impurities demonstrated mass accuracy of the monoisotopic peak within 2.5 ppm. Molecule Profiler software also performed thorough data analysis even with low-abundance species.
Table 4. Main impurities identified automatically by Molecule Profiler software in samples of ALC-0315 from 3 vendors. The relative abundance peak areas and abundance rank are included for each vendor.
Confirming the structure of selected ALC0315 impurities
Confirming the structure of identified impurities relies on information attained by the MS/MS data. EAD can provide an indepth characterization of singly charged ionizable lipids.4,5 The Molecule Profiler software interpretation workspace capitalizes on the information-rich MS/MS spectrum to facilitate the automatic structural elucidation and localization of chemical alteration sites.
N-oxidation of ionizable lipids can lead to covalent modification of ribonucleotides and a loss of mRNA potency. 1 A peak observed in the samples from the 3 vendors at RT 11.0 min with an m/z value of 782.7 was identified by Molecule Profiler software as an oxidized version of the main peak. This peak was assigned a structure with oxidation on the N of the head group (N-oxide ion) based on the EAD data (Figure 3A). The presence of diagnostic ions at m/z 187.2, 443.4 and 544.5 support the oxygen incorporation into the N of the head group. Figures 3B and 3C show the representative diagnostic fragment ions and their corresponding structures.
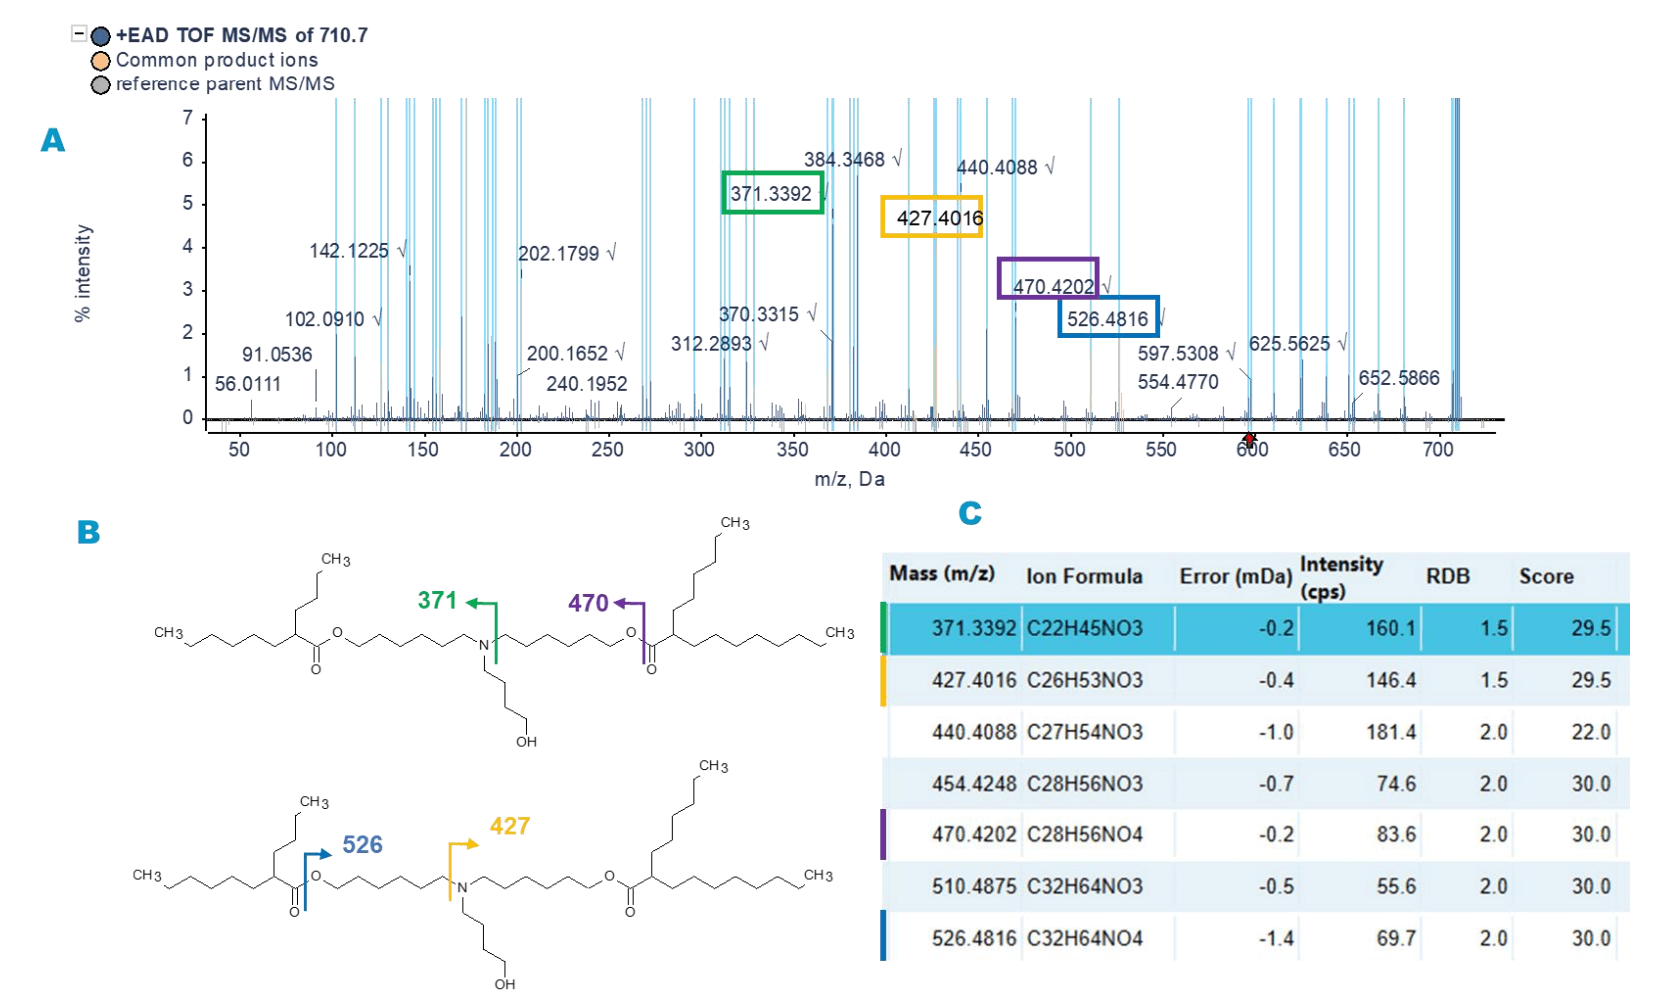
A unique peak at RT ~10 min with m/z of 710.7 was observed only in the sample from Vendor 3. An information-rich EAD MS/MS spectrum was acquired on the ZenoTOF 7600 system, despite its low 0.3% abundance in the 10000-fold diluted sample. Molecule Profiler software assigned the structure of the impurity as the loss of 2 ethyl groups from the side chain of ALC-0315. Figure 4 shows the EAD-MS/MS spectrum and the structural elucidation of the impurity. Diagnostic fragment ions with m/z of 470.4 and 371.3 suggest the probable loss of 4 CH2 groups from one of the side chains, with 2 CH2 on each of the alkyl chain branches. Fragment ions with m/z values 427.4 and 526.5 suggest that the other side of the chain remained intact (Figure 4).
Figure 3. Structural elucidation of the oxidation site of ALC-0315 by Molecule Profiler software. A) The EAD-based MS/MS spectrum of the oxidized impurity. When a peak was assigned to a proposed structure or formula, the peak was highlighted in light blue. B) The diagnostic fragment ions pinpointing the oxidation to the N of the headgroup. C) Selected fragment ions corresponding to the assigned peaks in panel A.
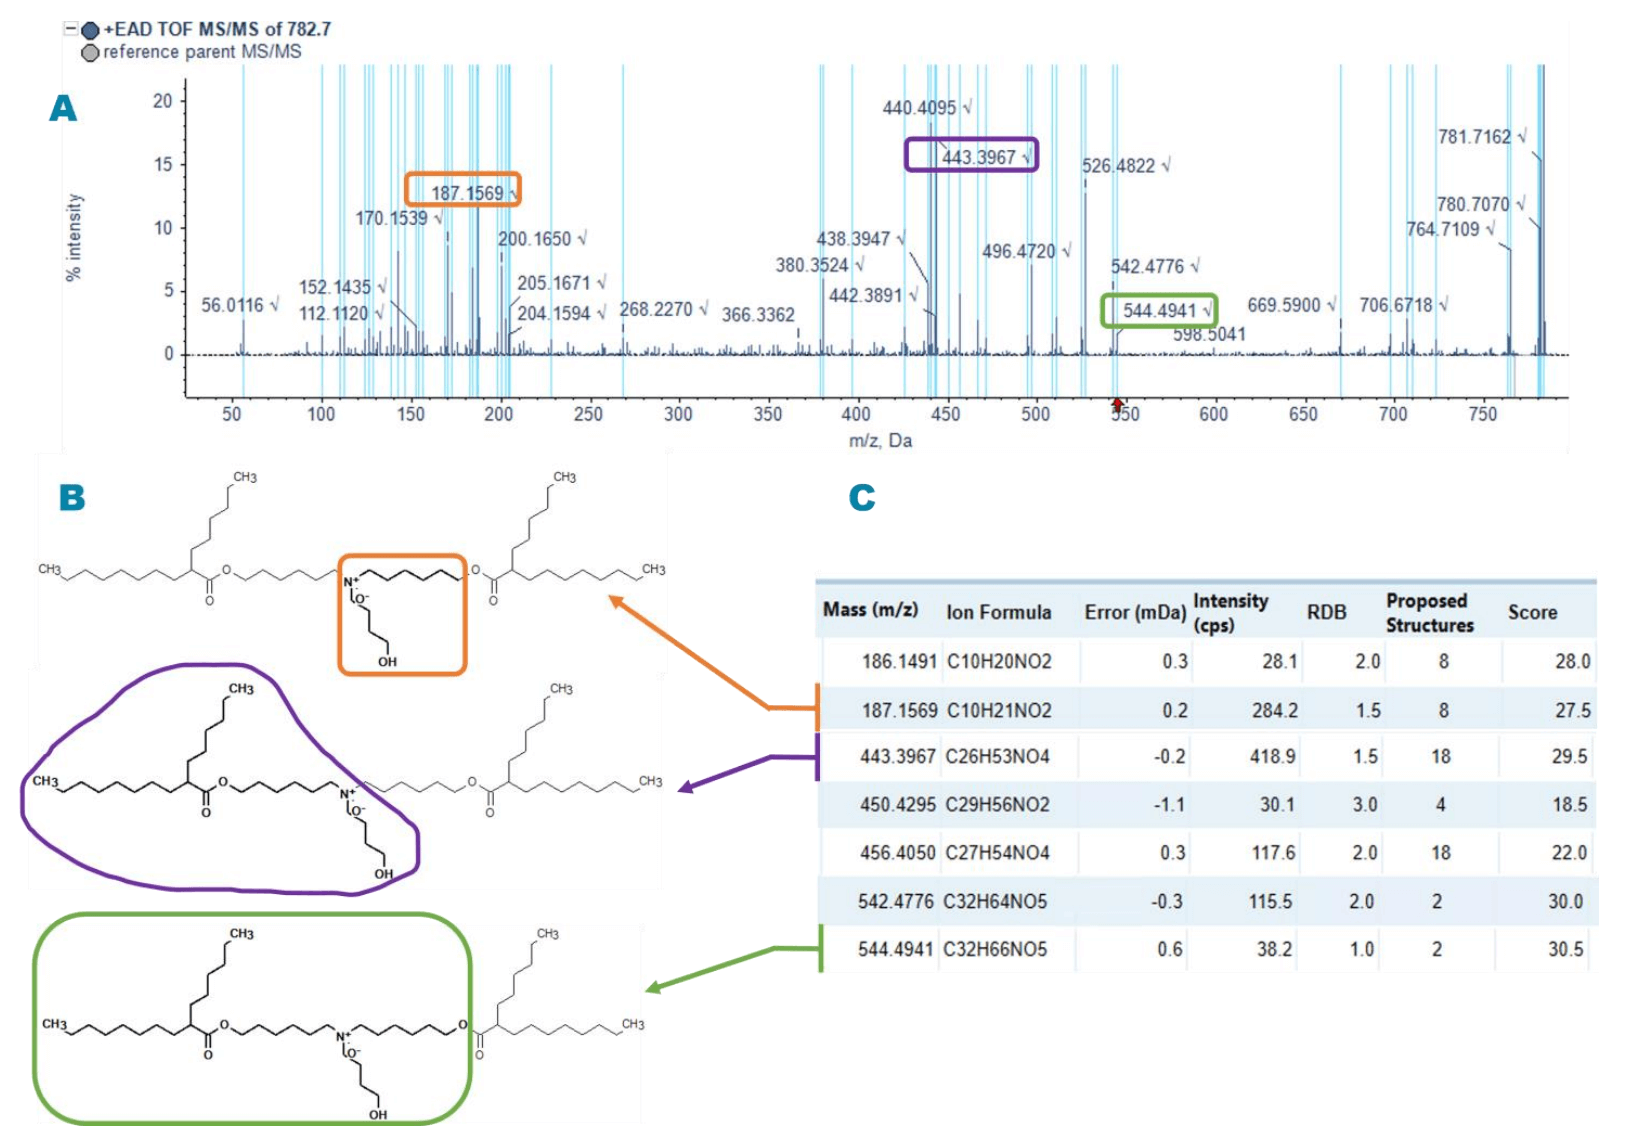
Figure 4. Structural elucidation by Molecule Profiler software of a distinct impurity with m/z of 710.6 found in the sample from Vendor 3. A) The EAD-based MS/MS spectrum of the impurity. B) The diagnostic fragment ions indicating the loss of 4 CH2 groups from one side of the chain. C) Selected fragment ions that correspond to the assigned peaks in panel A.
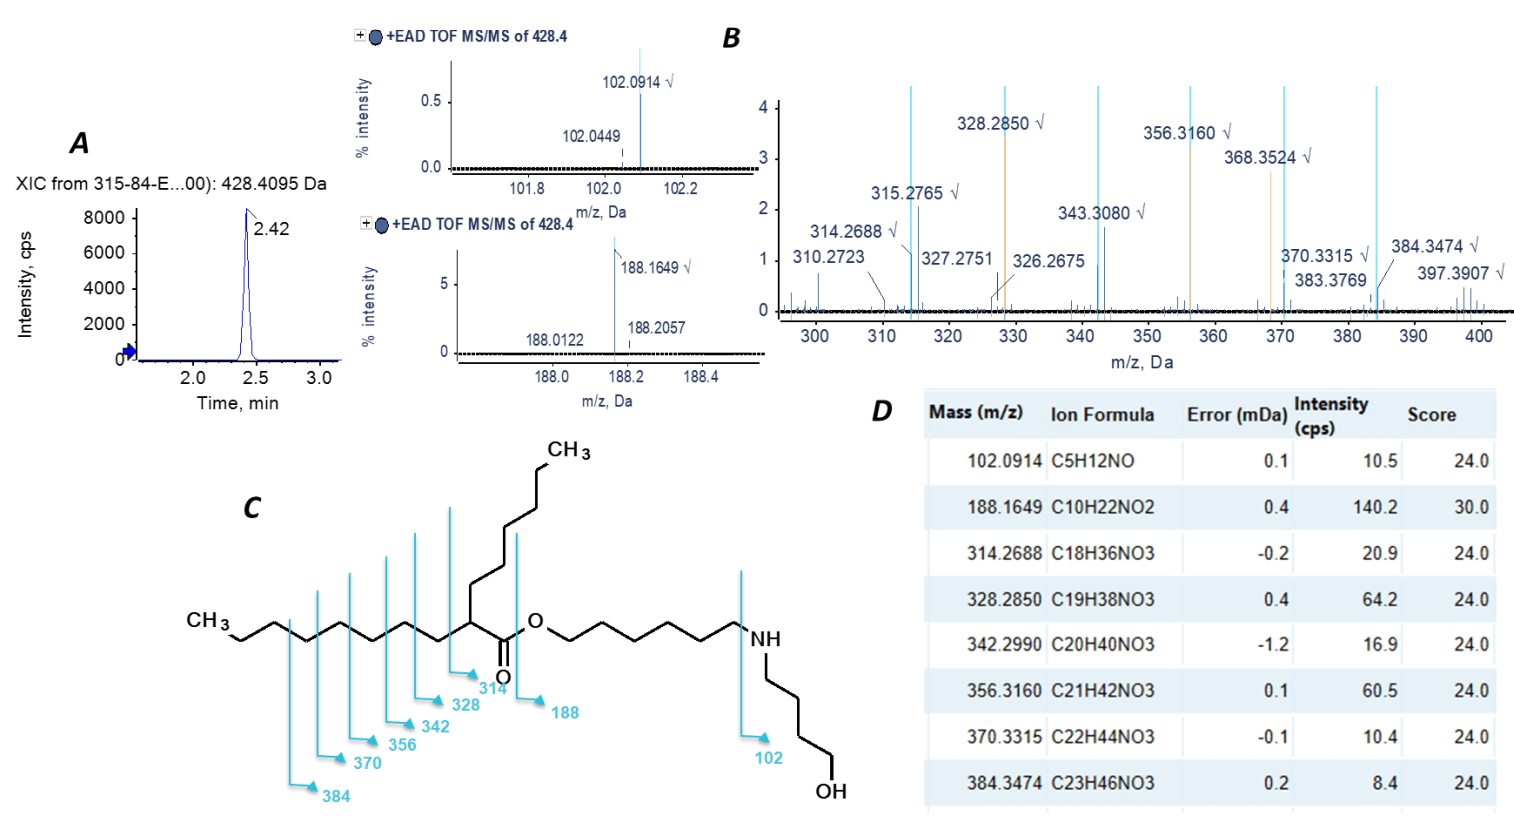
Molecule Profiler software elucidated the structure of lowabundance impurities with high confidence, leveraging the sensitivity gained by the Zeno trap and the information-rich EAD MS/MS spectra. Figure 5 shows the structural elucidation of an impurity (m/z = 428.4) with only 0.01% abundance in the sample from Vendor 3. In addition to the signature ions m/z values of 102.1 and 188.2 for definitive structural elucidation, EAD induced a series of C-C bond breaking, indicating the thorough structural analysis of singly charged ionizable lipids.
The workflow presented here offers a streamlined solution to characterize ionizable lipids and analyze lipid impurities. This workflow capitalizes on the detailed information obtained by EAD, in addition to the speed, sensitivity and wide dynamic range of the ZenoTOF 7600 system accompanied by the automatic structural elucidation capabilities of Molecule Profiler software. The workflow can be implemented for the routine analysis of ionizable lipids, quality control raw material testing and stability studies of LNP formulations. The data generated from this workflow can guide the design of safer, more efficient and more stable novel ionizable lipids to further unlock the potential of LNP-based therapeutics.
Figure 5. Structural elucidation of the low-abundance impurity with m/z 428.4 in the sample from Vendor 3. A) The XIC at m/z = 428.4095. The impurity that eluted at 2.41 min was analyzed in detail. B) The EAD-based MS/MS spectrum of the impurity. When a peak was assigned to a proposed structure or formula, the peak was highlighted in light blue. C) The structure of the impurity. D) Selected fragment ions corresponding to the assigned peaks in panel B
Conclusion
- Sensitive detection and confident identification of impurities in ionizable lipid ALC-0315 from 3 different suppliers were achieved using information-rich MS/MS spectra generated by EAD on the ZenoTOF 7600 system
- Molecule Profiler software assigned the TOF MS/MS spectral peaks produced by the ZenoTOF 7600 system, identifying diagnostic product ions and elucidating the structure of ALC0315 and related impurities
- The ZenoTOF 7600 system and Molecule Profiler software increased confidence in LNP product effectiveness and safety by profiling lipid raw materials and monitoring unwanted impurities such as N-oxide derivatives
References
- Packer M, et al. A novel mechanism for the loss of mRNA activity in lipid nanoparticle delivery systems. Nat Commun. 2021 Nov 22;12(1):6777. PMID: 34811367.
- Liang X, et al. Electron transfer dissociation of doubly sodiated glycerophosphocholine lipids. J Am Soc Mass Spectrom. 2007 Oct;18(10):1783-8. PMID: 17719238.
- Baba T, et al. Quantitative structural multiclass lipidomics using differential mobility: electron impact excitation of ions from organics (EIEIO) mass spectrometry. J Lipid Res. 2018 May;59(5):910-919. PMID: 29540574.
- Distinguishing oxidative impurities from ionizable lipids used in LNP formulations using electron-activated dissociation. SCIEX technical note, RUO-MKT-02-14983-A.
- Structural characterization of the lipid nanoparticle cationic lipid ALC-0315 and its impurities using electron-activated dissociation (EAD) based MS/MS fragmentation. SCIEX technical note, MKT-26966-A.